Sneak peek of Gaia's sky in colour
16 August 2017
While surveying the positions of over a billion stars, ESA's Gaia mission is also measuring their colour, a key diagnostic to study the physical properties of stars. A new image provides a preview of Gaia's first full-colour all-sky map, which will be unleashed in its highest resolution with the next data release in 2018.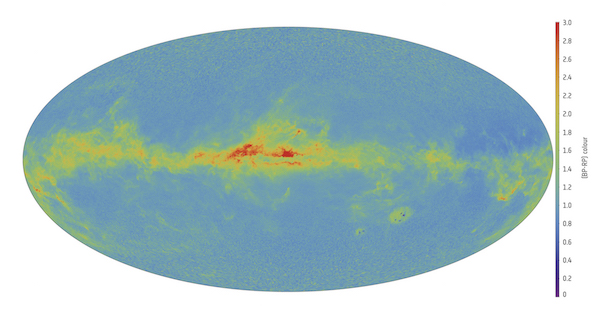 |
| Preliminary map of Gaia's sky in colour. Credit: ESA/Gaia/DPAC/CU5/DPCI/CU8/F. De Angeli, D.W. Evans, M. Riello, M. Fouesneau, R. Andrae, C.A.L. Bailer-Jones |
Stars come in a variety of colours that depend on their surface temperature, which is, in turn, determined by their mass and evolutionary stage.
Massive stars are hotter and therefore shine most brightly in blue or white light, unless they are approaching the end of their life and have puffed up into a red supergiant. Lower-mass stars, instead, are cooler and tend to appear red.
Measuring stellar colours is important to solve a variety of questions, ranging from the internal structure and chemical composition of stars to their evolution.
Gaia, ESA's astrometry mission to compile the largest and most precise catalogue of stellar positions and motions to date, has also been recording the colour of the stars it observes. The satellite was launched in December 2013 and has been collecting scientific data since July 2014.
A special effort in the Gaia Data Processing and Analysis Consortium (DPAC) is dedicated to the challenging endeavour of extracting stellar colours from the satellite data. While these measurements will be published with Gaia's second data release in April 2018, a preview of the Gaia sky map in colour demonstrates that the ongoing work is progressing well.
The new map, based on preliminary data from 18.6 million bright stars taken between July 2014 and May 2016 [1], shows the middle value (median) of the colours of all stars that are observed in each pixel. It is helpful to look at it next to its companion map, showing the density of stars in each pixel, which is higher along the Galactic Plane – the roughly horizontal structure that extends across the image, corresponding to the most densely populated region of our Milky Way galaxy – and lower towards the poles.
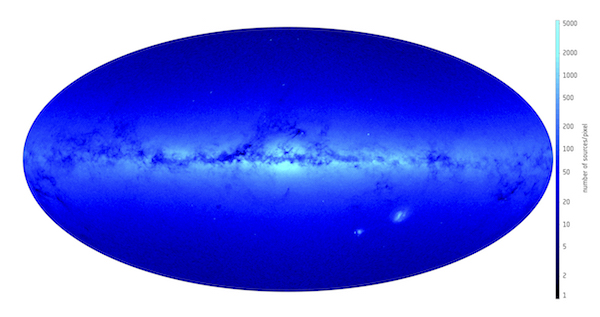 |
| Star density map. Credit: ESA/Gaia/DPAC/CU5/DPCI/CU8/F. De Angeli, D.W. Evans, M. Riello, M. Fouesneau, R. Andrae, C.A.L. Bailer-Jones |
Even though this map is only meant as an appetizer to the full treat of next year's release, which will include roughly a hundred times more stars, it is already possible to spot some interesting features.
The reddest regions in the map, mainly found near the Galactic Centre, correspond to dark areas in the density map: these are clouds of dust that obscure part of the starlight, especially at blue wavelengths, making it appear redder – a phenomenon known as reddening.
It is also possible to see the two Magellanic Clouds – small satellite galaxies of our Milky Way – in the lower part of the map.
The task of measuring colours is performed by the photometric instrument on Gaia. This instrument contains two prisms that split the starlight into its constituent wavelengths, providing two low-resolution spectra for each star: one for the short, or blue, wavelengths (330-680 nm) and the other for the long, or red, ones (640-1050 nm). Scientists then compare the total amount of light in the blue and red spectra to estimate stellar colours.
To precisely calibrate these spectra, however, it is necessary to know the position of each source on Gaia's focal plane to very high accuracy – in fact, to an accuracy that only Gaia itself can provide.
As part of the effort to extract physical parameters from the data sent back by the satellite, scientists feed them to an iterative algorithm that compares the recorded images of stars to models of how such images should look: as a result, the algorithm provides a first estimate of the star's parameters, such as its position, brightness, or colour. By collecting more data and feeding them to the algorithm, the models are constantly improved and so are the estimated parameters for each star.
 |
| Artist's impression of Gaia. Credit: ESA/ATG medialab; background image: ESO/S. Brunier |
The first Gaia data release, published in September 2016, was based on less than a quarter of the total amount of data that will be collected by the satellite over its entire five-year mission, which is expected to observe each star an average of 70 times. This first release, listing unprecedentedly accurate positions on the sky for 1.142 billion stars, along with their brightness, contained no information on stellar colours: by then, it had not been possible to run enough iterations of the algorithm to accurately estimate additional parameters.
As the satellite continues to observe more stars, scientists have now had more time to feed data to the iterative algorithm to obtain estimates of stellar colours, like the ones shown in the new map. These estimates will be validated, over the coming months, as part of the overall data processing effort leading to the second Gaia data release.
Since the first data release, scientists across the world have been using Gaia's brightness measurements – which are obtained over the full G-band, from 330 to 1050 nm – along with datasets from other missions to estimate stellar colours. These studies have been applied to a variety of subjects, from variable stars and stellar clusters in our Galaxy to the characterisation of stars in the Magellanic Clouds.
Next year, the second release of Gaia data will include not only the position and G-band brightness, but also the blue and red colour for over a billion stars – in addition to the long-awaited estimates of stellar parallaxes and proper motions based on Gaia measurements for all the observed stars [2]. This extraordinary dataset will allow scientists to delve into the secrets of our Galaxy, investigating its composition, formation and evolution to an unparalleled degree of detail.
Notes
[1] The preliminary colour map shows a sample of stars that have been selected randomly from all Gaia stars with G-band magnitudes brighter than 17 and for which both colour measurements (from the blue and the red channels of Gaia's photometric instrument) are available.
[2] Gaia's goal is to measure the parallax (a small, periodic change in the apparent position of a star caused by Earth's yearly revolution around the Sun, which depends on the star's distance from us) and proper motion (the motion of stars across the plane of the sky caused by their physical movement through the Galaxy) for over one billion stars. In the process, Gaia will measure also the brightness and colour of these stars, take spectra for a subset of them, and observe a variety of other celestial objects, from asteroids in our own Solar System to distant galaxies beyond the Milky Way.


