Another Dimension: 3D visualisation redefines Milky Way's local architecture
16 November 2015
Astronomers have used modern techniques to visualise data from ESA's Hipparcos space astrometry mission in three dimensions. The treatment of the data has offered insights into the distribution of nearby stars and uncovered new groupings of stars in the solar neighbourhood, shedding light on the origins of the stars in Orion and calling into question the existence of the Gould Belt – an iconic ring-shaped structure of stars in the Milky Way. The results show the potential of 3D visualisation of the solar neighbourhood, an approach which is of particular relevance to ESA's Gaia mission which will map the Milky Way and Local Group in 3D with unprecedented sensitivity and accuracy.
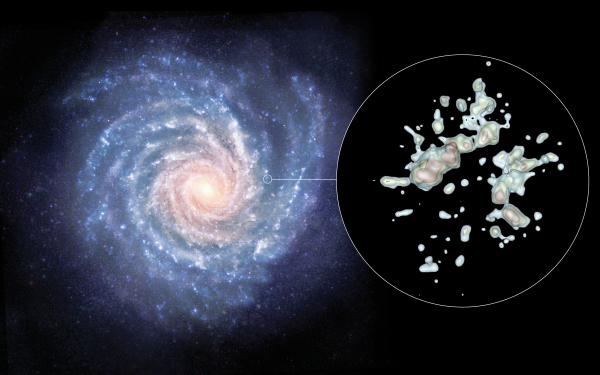 |
| Visualising the local solar neighbourhood in 3D. Credit: ESA. Acknowledgement: H. Bouy (CSIC-INTA) & J. Alves (U. Vienna) |
In a new study published in Astronomy & Astrophysics researchers have created a 3D map [1] of massive O and B type stars (sometimes referred to as OB stars) using data from ESA's Hipparcos satellite, launched in 1989 and operated until 1993. These stars, which live for a maximum of only a few tens of millions of years, are important markers of recent star formation and much can be learnt from studying their distribution in the solar neighbourhood.
Previous studies have looked for groupings of these stellar giants by seeking out concentrations of them in 2D projections. Astronomers use these 2D projections to look at the position and velocity of the stars in a given region and pick out stars that are moving together, and are thus most likely members of the same stellar group.
"Mapping data from missions like Hipparcos in two dimensions has allowed us to identify and classify numerous stellar groups and has profoundly changed our knowledge and understanding of the solar vicinity," explains Hervé Bouy from the Center for Astrobiology (CSIC-INTA), Spain, lead author of the study. "But it comes with significant drawbacks. 2D projections are just not capable of describing all the features of 3D space and using them to model distributions can cause artificial structures to appear and important structures to be hidden in the projection and lost."
Among other drawbacks, all 2D projection methods, including those not described here [2], can be affected by the presence of companion stars. Binary stars – two stars which orbit one another – can interfere with measurements of the motion of the stars in a group causing smaller or less tightly bound groups to be missed when searching for them solely on the basis of their common motion. In this study, rather than project the data onto a series of 2D planes, the astronomers used the measured distances to O and B type stars in the data to map the density and position of the stars in three dimensions. The 3D data analysis and interactive visualisation techniques used in this study, combined with a lack of reliance on velocities as a discovery criterion for the stellar groups, led to several discoveries that had been missed in 25 years of 2D analysis of the data.
"Our study has shown just how different the architecture of the solar neighbourhood looks when mapped in three dimensions," explains João Alves from the University of Vienna, Austria, co-author of the paper. "We have produced a 3D visualisation of all of the Hipparcos O and B type stars within around 1500 light years of the Sun and in doing so have found evidence for new structures in the distribution of nearby hot stars, and new and surprising theories of how those stars formed."
The team found that the solar neighbourhood is dominated by three huge stream-like galactic structures made up of dense clusters and loose associations of young, blue, O and B type stars. These contain several tens of O and B type stars, most of the local well-known clusters, and some previously unreported stellar groups. The first structure runs from the constellation Scorpius to the constellation Canis Majoris covering more than 1100 light years and at least 65 million years of star formation history. The second, located in the constellation Vela, covers at least 500 light years and 30 million years of history. Although all three of the newly discovered streams have a story to tell, it is the third structure, located in the constellation Orion, that is perhaps the most significant due to its mystery-solving qualities.
The origin of the blue supergiants that define the body and belt of the Orion constellation has long been a mystery. The five giant O and B type stars are located between around 250 and 800 light years from Earth and as a result it was assumed that their origin was not, despite their name, in the prolific Orion Nebula star-forming region, which lies around 1300 light years from Earth. However, the discovery of the Orion stream offers a simple solution. It implies that these relatively distant populations are in fact linked as part of a large galactic structure, which spans more than 1000 light years and at least 25 million years of star formation history.
The origin of the body and belt are not the only answers this study might hold for the birth of the Hunter.
"One exciting find from this study relates to Betelgeuse, the red giant in the arm of Orion," remarks Bouy. "The origin of this star has always been shrouded in mystery but through this study we have uncovered a new loosely organised group – or OB association – named Taurion which we believe to be Betelgeuse's birthplace and to contain its sibling stars."
By using modern full-3D data analysis, Bouy and Alves have not only uncovered the previously unknown, they may also have identified a significant visual illusion produced by previous 2D methods. In the 19th century, British astronomer John Herschel and then American astronomer Benjamin Gould identified a 3000 light-year-long partial ring of O and B type stars in the Milky Way. This belt, projected on the sky, was thought to be a grouping of stars and has come to be known as the Gould Belt – a famous and prominent structure in the Milky Way. Now, Bouy and Alves have shown that when mapped in three dimensions this model does not in fact provide a good fit for the distribution of O and B type stars, potentially disproving the existence of this galactic icon and calling for a new interpretation of stellar groups in the solar neighbourhood.
"The Gould Belt is the perfect example of how 2D projections can deceive astronomers," argues Alves. "Our results imply that it is just a projection effect produced by the Sun's position between two of the streams of stars, rather than representing the architecture of the solar neighbourhood itself."
The results published in this study include caveats and possible sources of error in part due to the extinction in the Hipparcos data, in other words the amount of light that was absorbed and scattered by dust on its way to the telescope, compromising the quality of the data. The study is also biased towards young stars, due to its focus on O and B type stars, and dense stellar groups. Despite this, the results show that our current models of the solar neighbourhood are not sufficient to uncover the true structure of how its stellar inhabitants are distributed or trace the history of their formation and evolution, there is significantly more to learn about our local environment.
"These results show just what 3D visualisation can deliver, and how much further it can take us," explains Jos de Bruijne, ESA's Gaia system scientist, also acting as ESA liaison scientist for the Hipparcos mission. "It provides an even stronger case for focussing on the local neighbourhood and, in particular, for doing so in three dimensions. This study really raises the expectations for what the Gaia mission will produce."
Gaia was launched in 2013 with the aim of unveiling the origin and evolution of our Galaxy. It will provide measurements of the positions and velocities with respect to Earth of up to one billion stars in our Galaxy and Local Group with unprecedented accuracy and sensitivity. The three-dimensional map produced by Gaia will far outdo any current or foreseen maps of the stars in the Milky Way. It will include non-O and-B type stars and be able to identify clusters and groups not dense enough to register in the Hipparcos map.
The success of the Hipparcos study in highlighting the benefits of visualising 25-year-old data using modern visualisation methods emphasises the potential of stellar mapping in 3D and Gaia will provide the data needed to peer further into the origin, evolution and structure of our Galaxy.
An interactive tool showing the Hipparcos data represented in three dimensions is available online.
Notes
[1] Hervé Bouy and João Alves have created an interactive tool to show the distribution of O and B stars in the solar neighbourhood. A low-resolution version (quicker loading time) is available here; a high-resolution version is available here.
[2] Astronomers also use what is called the convergent point method, a method which is responsible for identifying most of the O and B type star associations and clusters discovered so far. Whilst unrelated stars will move in random directions, those in a group will move towards a convergence point where the paths of all its members will intersect.
More Information
"Cosmography of OB stars in the solar neighbourhood" by H. Bouy and J. Alves is published in Astronomy & Astrophysics, November 2015.
ESA's Hipparcos space astrometry mission was a pioneering European project which pinpointed the three-dimensional positions of more than one hundred thousand stars with high precision, and more than one million stars with lesser precision. Launched in August 1989, Hipparcos successfully observed the celestial sphere for 3.5 years before operations ceased in March 1993. Calculations from observations by the main instrument generated the Hipparcos Catalogue of 118 218 stars charted with the highest precision. An auxiliary star mapper pinpointed many more stars with lesser but still unprecedented accuracy, in the Tycho Catalogue of 1 058 332 stars. The Tycho 2 Catalogue, completed in 2000, brings the total to 2 539 913 stars, and includes 99 per cent of all stars down to magnitude 11, almost 100 000 times fainter than the brightest star, Sirius.
Gaia is an ESA mission to survey one billion stars in our Galaxy and local galactic neighbourhood in order to build the most precise 3D map of the Milky Way and answer questions about its origin and evolution. Launched in December 2013, Gaia's routine science operations began in July 2014. The mission's primary scientific product will be a catalogue with the positions, motions, brightnesses, and colours of the surveyed stars. An intermediate version of the catalogue will be released in 2016.
Contacts
Herve Bouy
Center for Astrobiology (CSIC-INTA), Spain
Email: hbouy![]() cab.inta-csic.es
cab.inta-csic.es
Phone: +34 622 27 1401
João Alves
University of Vienna, Austria
Email: joao.alves![]() univie.ac.at
univie.ac.at
Phone: +43 1 4277 53810
Jos de Bruijne
ESA liaison scientist for Hipparcos
Scientific Support Office
Directorate of Science and Robotic Exploration
ESA, The Netherlands
Email: jdbruijne![]() cosmos.esa.int
cosmos.esa.int
Phone: + 31 71 565 5989
