Results from the PFS Instrument
| Type: Image Data: Orbit 30 Location: Southern Polar Cap Description: The ice around the southern polar cap is clearly seen. Overlayed is the footprint of the PFS measurements from which the ice composition has been determined. |
 |
| Type: Graph Displays: Results of laboratory studies of water and CO2 ices performed by G. Hansen, a CoI on the PFS instrument. Explanation: The figure indicates that CO2 ice is full of many thin absorption bands, which should be clearly visible if the ice on Mars is purely from carbon dioxide. If water ice is mixed with it, then the continuum of the spectrum is depressed and the bands become shallower. The lower the CO2 content the narrower the CO2 band at 3700 cm-1 and the rising slope, at 3800 cm-1 in the laboratory experiment, will move towards 3700 cm-1. |
 |
| Type: PFS Spectrum Displays: A portion of a spectrum measured over the south polar cap Explanation: CO2 ice features are observed at 2725, 2770, 3000 and 3330 cm-1 . A similar spectrum, observed at the equator of Mars, is shown for comparison. The three bands between 2840 and 2950 cm-1 are due to contamination of the pointing mirror, caused in space by an, as yet, unknown reason. Note that the bands are not deep, indicating that water ice may also be present. |
 |
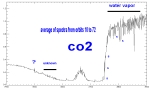
| Type: PFS Spectrum Displays: Portion of spectrum where water ice is most clearly observed - between 3750 and 3950 cm-1. Explanation: The comparison with the equatorial spectrum shows the presence of a wide absorption band due to water ice. In both cases a large number of water lines (water vapour in the atmosphere) are present. Note also another absorption band due to CO2 ice at 4370 cm-1. |
 |
| Type: PFS Spectrum Displays: One wide PFS spectrum shown as a scrolling flash animation Explanation: One composite PFS spectrum generated from over 1600 measurements. Revealed is the detail of the existing data and indicates some of the unanswered questions. The gaseous species are indicated : CO, CO2, H2O, HDO, NH3 , S is for solar line. The solar spectrum is essentially unknown in half of the PFS region - these are the first space measurements at medium spectral resolution of the solar spectrum. To determine if a line is of solar, or martian origin is a challenging task. There are many regions with features detected that are not yet identified. |
Flash: Click on the image to see the animation. Point your mouse in the direction you want to move. The spectrum consists of 16 separate images and the vertical scale changes from image to image. |
Last Update: 1 September 2019
