Stellar Distances
Introduction
On a clear, dark night we may be able to see a few thousand stars in the sky, a tiny proportion of the billions of stars that are thought to exist in the Milky Way alone. Although the stars we see with the naked eye look similar in size, they vary enormously in their distance from the Earth. Furthermore, how bright a star appears is ultimately no indication as to how close it is to us. Astronomers use many different ways to determine just how far away a star is. Almost all are based on parallax.
Parallax
If you hold one finger at arm's length in front of your face and close each eye in turn, you will see that the finger appears to move compared to distant objects behind it. This apparent movement is known as parallax. Astronomers use this effect to measure the distance to stars by determining the angle between the lines of sight of a star from two different positions of the observer.
ESA's Hipparcos Mission
Launched in 1989 the ESA Hipparcos mission used the parallax method to observe positions of stars within the galaxy. As a result of the mission two catalogues of observations were produced:
- The Hipparcos Catalogue - 120 000 stars to a precision 200 times better than any previous observations.
- The Tycho Catalogue - detailed distribution and data map of a further 1.2 million stars.
The parsec
Since stars are distant, the parallax angle is very small and is usually measured in arc seconds (fractions of a degree) rather than degrees. The term parsec is derived from:
"The distance at which an object has a parallax of one arcsecond."
An arcsecond is equivalent to 1/3600 of a degree, that is an angle of one second of arc (") is equal to one sixtieth of one minute of arc ('), and one minute of arc equals one sixtieth of a degree.
| 1 parsec = 3.26 light years = 3.09 x 10¹³ km = 206 265 AU |
|
Object |
km |
AU |
Light Time |
Parsec |
| Moon |
3.84 x10⁵ |
2.57 x10⁻³ |
1.28[1] |
1.25 x10⁻⁸ |
| Sun |
1.50 x10⁸ |
1.00 |
499[1] |
4.85 x10⁻⁶ |
| Saturn |
1.48 x10⁹ |
9.54 |
79.33[2] |
4.63 x10⁻⁵ |
| Proxima Centauri |
3.99 x10¹³ |
2.67 x10⁵ |
4.22[3] |
1.294 |
| Pleiades Cluster |
4.26 x10¹⁵ |
2.85 x10⁷ |
450[3] |
1.38 x10² |
| LMC/SMC |
1.31 x10¹⁷ |
8.73 x10⁸ |
13 803[3] |
4.23 x10³ |
| Andromeda | 2.18 x10¹⁹ |
1.45 x10¹¹ |
2 300 000[3] |
7.05 x10⁵ |
Table 3.1: Distances to various astronomical objects in different units.
It is clear from this table why different units are used for defining distances to different objects.
Table notes:
- Light Time is the distance as measured if travelling at the speed of light:
[1] Light Seconds [2] Light Minutes [3] Light Years - Proxima Centauri is the closest star to the Sun
- The Pleiades Cluster is a nearby open cluster of stars also known as the Seven Sisters
- The Large Magellanic Cloud (LMC) and the Small Magellanic Cloud (SMC) are small satellite galaxies of own galaxy visible from the southern hemisphere
- Andromeda is the nearest major galaxy to the Milky Way
Stellar Parallax
To determine the distance to a star, astronomers measure the apparent change in its position over one year. As the Earth orbits the Sun during this period, the observer (taking measurements at the opposite sides of the Earth's orbit) notices an apparent movement of the star compared to more distant stars. The closer a star is to the Earth the greater the observed parallax.
|
|
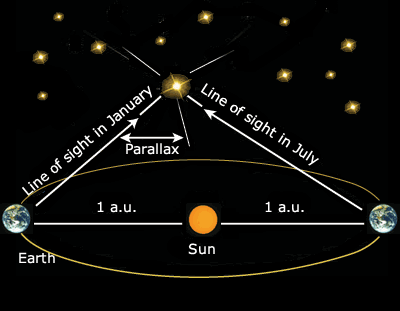
Figure 3.1: Astronomers measure the apparent shift in the star's position at different times of the year.
As in the diagram, the lines of sight and the line connecting the observer's position form a triangle, with the star at the apex. The parallax of the star is equal to the angular radius of the Earth's orbit as seen from the star. The distance d to the star (measured in parsecs) is equal to the reciprocal of the parallax angle p (in arc-seconds):
| d(parsec) = 1/ p(arcsecond) |
Limits on Parallax
The greater the distance to the star, the wider the baseline required for obtaining a discernible parallax. The baseline for observations from the Earth is limited to our planet's orbit around the Sun. Parallax angles smaller than about 0.01 arcsecond are very difficult to measure accurately from Earth, therefore stellar distances for stars further than around 100 parsecs cannot be measured from Earth.
However, ESA's Hipparcos satellite, unrestricted by the Earth's orbit or its atmosphere, spent three and a half years measuring star positions with unprecedented accuracy. Hipparcos allowed astronomers to measure the parallaxes of 120 000 stars, up to 500 light years (about 150 parsecs) from the Sun. Another experiment on the Hipparcos satellite, called Tycho, measured parallaxes for more than 1 million stars in the Galaxy, although to lesser accuracy.
Distances using parallax
|
|
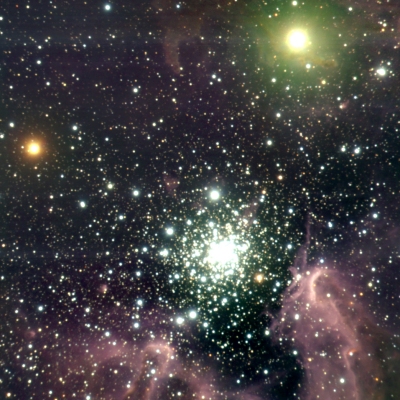
Figure 3.2: ESO image of the starburst cluster (NGC 3603). To the eye all the stars look like they are at the same distance, but some are closer and others further away.
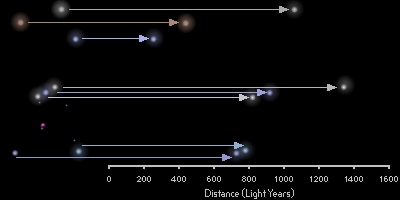 |
Figure 3.3: The stars in the constellation of Orion all look like they are at the same distance. Turn the constellation through 90° and the stars are actually at different distances.
Calculating Distance from Parallax
Consider the star α Canis Major, also known as Sirius, the brightest star in the night sky. Sirius has a parallax of 0.37921 arcseconds.
To calculate the distance, in terms of light-years, we use the equation introduced earlier:
| d(parsec) = 1/p (arcsecond) |
| Distance = 1/0.37921 = 2.637 parsecs |
To convert from parsecs into light-years this result must be multiplied by 3.26.
| Distance to α Canis Major = 2.637 x 3.26 = 8.6 light-years |
Apparent & Absolute Magnitude
Some stars appear very bright but are actually fainter stars that lie closer to us. Similarly, we can see stars that appear to be faint, but are intrinsically very bright ones lying far away from Earth. The Greek astronomer Hipparchus was the first to categorise stars visible to the naked eye according to their brightness. Around 120 BC, he invented six different brightness classes, called magnitudes, where the brightest stars were magnitude 1 and the faintest were categorised as magnitude 6. Today, astronomers use a revised version of Hipparchus's magnitude scheme called 'apparent magnitudes', as well as 'absolute magnitudes' to compare different stars.
Apparent Magnitude
The power radiated by a star is known as its luminosity. However, the apparent magnitude, m, is the power received by an observer on Earth. Since we now can see very faint stars using telescopes, the scale extends beyond the magnitude 6 that Hipparchus marked down as the faintest on his scale.
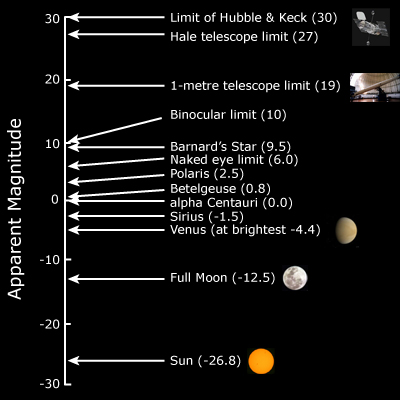 |
Figure 3.4: Apparent magnitude scale and observational limits
As you can see, the magnitude numbers are bigger for faint stars, and magnitudes are negative for very bright stars. Since the scale is logarithmic, a magnitude 1 star is 100 times brighter than a magnitude 6 star, i.e. the difference between each step on the scale is equal to a decrease in brightness of 2.512 and (2.512)5 = 100.
Absolute Magnitude
Comparing apparent magnitudes is a useful reference for astronomers, and these often appear next to stars on star maps. Apparent magnitude, however, does not tell us about the intrinsic properties of the star, so it is necessary to use the concept of absolute magnitude.
The absolute magnitude, M, of a star is defined as what the apparent magnitude of that star would be if it were placed exactly 10 parsecs away from the Sun. Most stars are much further away than this, so the absolute magnitude of stars is usually brighter than their apparent magnitudes.
To calculate the absolute magnitude for stars, we use the following equation:
| M = m - 5 log (D/10) |
The value m-M is known as the distance modulus and can be used to determine the distance to an object, often using the following equivalent form of the equation:
| D = 10 (m-M+5)/5 |
|
Star |
Star |
Parallax |
Apparent |
Absolute |
| α Canis Majoris | Sirius |
0.37921 |
-1.44 |
1.45 |
| α Carinae | Canopus |
0.01043 |
-0.62 |
-5.53 |
| α Boötis | Arcturus |
0.08885 |
-0.05 |
-0.31 |
| α1 Cenaturi | Rigel Kent |
0.74212 |
-0.01 |
4.34 |
| α Lyrae | Vega |
0.12893 |
0.03 |
0.58 |
| α Aurigae | Capella |
0.07729 |
0.08 |
-0.48 |
| β Orionis | Rigel |
0.00422 |
0.18 |
-6.69 |
| α Canis Minoris | Procyon |
0.28593 |
0.40 |
2.68 |
| α Orionis | Betelgeuse |
0.00763 |
0.45 |
-5.14 |
| α Eriadani | Achernar |
0.02268 |
0.45 |
-2.77 |
Table 3.2: Apparent and Absolute Magnitudes for the ten brightest stars on the night sky
Luminosity from Stellar Spectra
Scientists use spectroscopic parallax to estimate the luminosity of a star from its spectrum (the different wavelengths shown as a band of colours when a spectrograph splits the light from a star into its electromagnetic waves).
Be careful not to confuse spectroscopic parallax with the parallax we have been discussing earlier. Scientists use spectroscopic parallax to measure the distance to stars, by assuming that spectra from distant stars of a given type are the same as those from nearby stars of the same type.
They use the Hertzsprung-Russell diagram, which gives a place to each star according to the point it has reached in its lifecycle. This method enables scientists to estimate the luminosity of a star that is far away by comparing its spectrum to those of nearer stars.
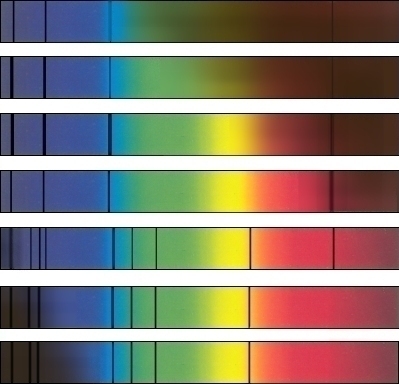 |
Figure 3.5: Recreated stellar spectra by class (from top to bottom): O, B, A, F, G, K, M
Distances derived from Apparent Brightness and Luminosity
Once the luminosity of a star has been estimated, its distance can be determined by using its apparent brightness. To do this, we use the inverse square law, which states that a star's apparent brightness decreases with the square of its distance. For instance, if you take two stars of the same luminosity, they will differ in brightness by four times if one star is twice as far away as the other. To determine distance, we use the following equation:
 |
|
|

Since the Sun is our nearest star, it is usually taken as the reference star.
By comparing another star's luminosity and apparent brightness to that of the Sun, using this formula, it is possible to determine its distance:
 |
 |
Limits on Spectroscopic Parallax
Spectroscopic parallax is only accurate enough to measure stellar distances of up to about 10 kpc. This is because a star has to be sufficiently bright to be able to measure the spectrum, which can be obscured by matter between the star and the observer. Even once the spectrum is measured and the star is classified according to its spectral type there can still be uncertainty in determining its luminosity, and this uncertainty increases as the stellar distance increases. This is because one spectral type can correspond to different types of stars and these will have different luminosities.
Example
1 - Spica
- Apparent magnitude, m = 0.98
- Spectral type is B1
- From H-R diagram this indicates an absolute magnitude, M, in the range: -3.2 to -5.0
M= -3.2, D = 10 (0.98 - (-3.2) +5)/5 = 68.54 pc
M= -5.0, D = 10 (0.98 - (-5.0) +5)/5 = 157.05 pc
2 - Tau Ceti
D = 10 (m-M+5)/5
The Hipparcos measurements give d = 80.38 pc
- Apparent magnitude, m = 3.49
- Spectral type is G2
- From H-R diagram this indicates an absolute magnitude, M, in the range: +5.0 to +6.5
M= +5.0, D = 10 (3.49 -5.0 +5)/5 = 5.00 pc
M= +6.5, D = 10 (3.49 -6.5 +5)/5 = 2.50 pc
D = 10 (m-M+5)/5
The Hipparcos measurements give d = 3.64 pc
Cepheid Variables
Cepheid variables are very luminous stars that pulsate in a regular cycle, with rapid brightening followed by gradual dimming. They are named after the star delta Cephei, a naked eye star, which was the first of this type to be identified. Cepheids are relatively rare, but their unique properties enable scientists to measure the distance to stars in galaxies more than 10 Mpc away. Since it is very difficult to tell the difference between a light source that is far away and a dimmer source that is nearer to us, measuring the distance to other galaxies is one of the greatest challenges facing astronomers. Cepheid variables are a fantastic tool to help them.
Light Curves
The outer layers of a Cepheid variable star pulsate in a manner that is predictable. The outer layers of the star periodically expanding and contracting cause this pulsation.
Observations of Cepheids with well-known distances showed that a well-defined correlation exists between the average luminosity of a Cepheid star and its pulsation period. If a pulsating star, therefore, is detected in a distant galaxy, and it is identified as a Cepheid from its period and its spectral characteristics, its apparent brightness and its pulsation period can be used to determine its distance, which can also be defined as the distance to the cluster or galaxy in which it is found. Astronomers, therefore, have used the period-luminosity relationship to determine distances to galaxies.
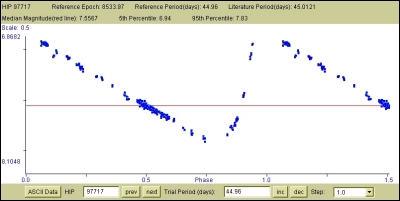 |
Figure 3.7: Lightcurve for a classic Cepheid (SV Vul) - period of 44.96 days
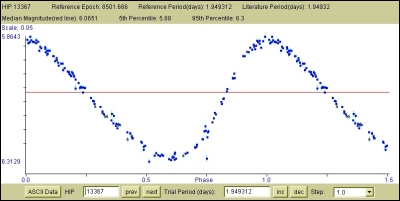 |
Figure 3.8: Lightcurve for a classic Cepheid (SU Cas) - 1.949 days
You can find the light curves for these and other Cepheids on the Hipparcos web pages at:
http://www.rssd.esa.int/index.php?project=HIPPARCOS&page=Epoch_Photometry
Period - Magnitude Relationship
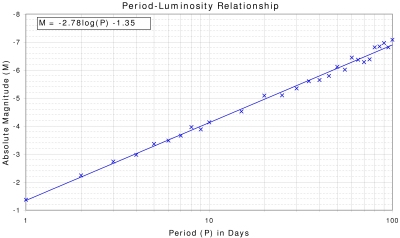
To determine the average absolute magnitude for Cepheids, the following equation is used:
| M = -2.78 log (P) - 1.35 |
Where M is the absolute magnitude of the star and P is the period measured in days.
Cepheids as 'Standard Candles'
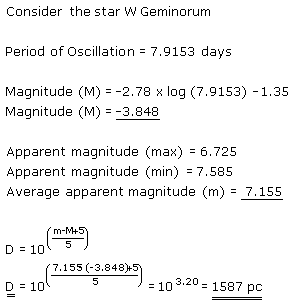
When we observe another galaxy, we can assume that all its stars are around the same distance from the Earth. A source of known luminosity in that galaxy enables us to make comparisons with all the other stars in the galaxy to determine their luminosity. Cepheid variable stars, which are thousands of times more luminous than the Sun, provide us with such a benchmark, known in astronomy as a "standard candle". By observing the period of any Cepheid, you can deduce its absolute brightness. Then, using an observation of its apparent brightness, the distance to it can be calculated. Henrietta Leavitt first discovered the period-luminosity relationship of Cepheids in 1912 for Cepheids in the nearby galaxy called the Small Magellanic Cloud.
Distance to Cepheids
It is possible to estimate the distance to a Cepheid in a far-off galaxy as follows: firstly, locate the Cepheid variable in the galaxy, then measure the variation in its brightness over a given period of time. From this you can calculate its period of variability. You can then use the luminosity-period graph (below) to estimate the average luminosity. Finally, armed with the average luminosity, the average brightness and using the inverse square law, you can estimate the distance to the star.
 |
|
Figure 3.9: Period Luminosity Relationship for Cepheids |
 |