Spectra of NGC5548

Date: 15 September 1989
Satellite: IUE
Depicts: Evolution of NGC5548's UV spectrum
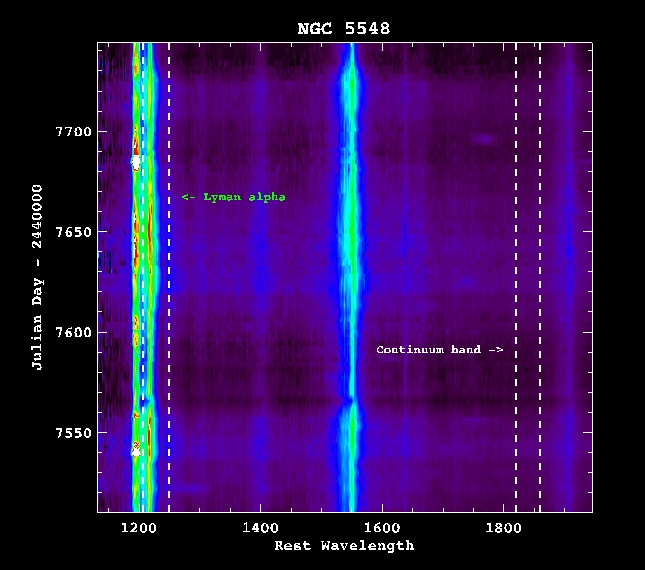
NGC 5548 has been repeatedly observed with IUE. The figure shows the evolution of the IUE SWP spectra of NGC 5548 taken in the period December 1988 to September 1989, when it was observed regularly every four days. The vertical axis represents time (in Julian day - 2 440 000) and the horizontal axis gives the wavelength, increasing to the right (1150 to 1950 Å).
The emission lines in the figure correspond (from short to long wavelengths) to the Lyman alpha geocoronal line (emitted by the Earth's atmosphere), the Lyman alpha line emitted by the galaxy (displaced from the geocoronal line due to the galaxy's recessional velocity), the weak SiIV line near 1400 Å , the CIV line at 1550 Å, and the weak CIII line at 1910 Å.
In this image it is possible to see the correlated variations of the slightly redshifted Lyman alpha and CIV emission lines.