No. 37 - Start of Moon Eclipse Season
Otherwise the spacecraft status is good with all functions working nominally.
Future activities
- Resume instrument commissioning and start Science
- Fine tune procedures and tools to optimise Lunar phase
Spacecraft Status
AOCS
The Moon eclipse season started on 7 April 2005 and will last until 20 June 2005. The eclipses are currently occuring shortly after the perilune passage and lasting up to a maximum of 20 minutes.
Star Trackers
The star tracker temperatures continue to vary depending on the operational conditions of the spacecraft. During routine science operations the temperatures of both star trackers are below the desired 19 °C. During two Medium Gain Antenna (MGA) Earth pointings, lasting up to 10 hours each, the temperature in ST#1 reached a peak of 24 °C. The cause of this rise in temperature is not yet clear, but one theory being considered is the effect of Lunar infrared radiation.
During MGA pointings the main thermal inputs are:
- Direct solar illumination causing a general heating in platform temperatures
- Slight illumination of the inner baffle of ST#2 causing a small temperature
In this case, however, ST#1 showed not only the highest temperatures, but there were high temperature variations even though the solar illumination changes gradually. In future, analysis could be undertaken to confirm that these variations are caused by Lunar infrared radiation.
Power
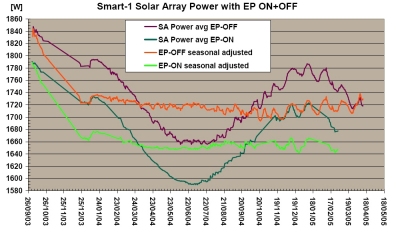
The plot below shows analysis of the Solar Array (SA) power throughout the mission. The plots also show the seasonally adjusted (Earth orbital effect only) trend, with the oscillations at the end due to uncorrected lunar orbital effects.
 |
|
SA power through the mission (courtesy of P. Rumler - ESA/ESTEC) |
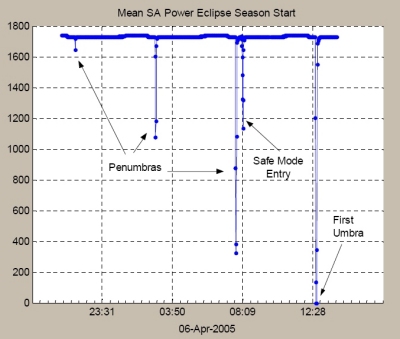
As mentioned elsewhere the spacecraft has now entered a period of eclipses. The diagram below shows how the SA power output falls steadily as the penumbral phase increases and finally reaches an umbral phase.
 |
|
SA power through the first eclipses |
Orbital Information
|
SMART-1 OD301 - Close to Apolune 401 | |
| Pericentre Distance (km) | 2271.862078 |
| Apocentre Distance (km) | 4535.563122 |
| Semi Major Axis (km) | 3403.712600 |
| Eccentricity | 0.332534 |
| Inclination (°) | 89.710424 |
| Ascending Node (°) | 236.666779 |
| Argument of Pericentre (°) | 276.712045 |
| True Anomaly (°) | 180.017573 |
| Osculating Orbital Period (h) | 4.949765 |
The changes since apolune 369 are as follows:
- Semi-major axis: +0.2 km
- Perilune height: +14.5 km
- Apolune height: -14.1 km
- Orbital period: +0.0 min