Results from Venus Express
Below are listed some highlights of the scientific results from the ESA Venus Express mission. The full details of each result, including the high-resolution versions of the image or video data, can be obtained by clicking on the corresponding highlight image.
14 July 2009
|
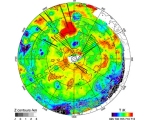
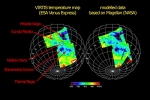
Instrument: VIRTIS
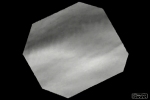
Description: The first infrared map of the surface temperature on Venus in the southern hemisphere has been obtained with VIRTIS. The measured temperatures lie in the range 422 °C - 442 °C. The derived differences in surface rock composition are consistent with suspicions that Venus once had a plate tectonics system and an ocean of water. |
 |
24 February 2009
|
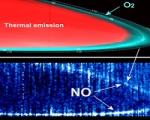
Instrument: VIRTIS
Description: A faint and variable nightglow of nitric oxide (NO) has been unambiguously detected in the upper atmosphere of Venus. This is the first time NO nightglow has been detected in the infrared for any planet. Venus's nightglow of O2 and OH had already been observed by Venus Express. |
 |
3 December 2008
|
Instrument: VIRTIS and VMC
Description: The connection between the UV absorption features and the physical conditions and dynamical processes at the cloud tops have long been unclear. A study by Dmitry Titov and colleagues finds the distribution of the UV absorbers is closely related to the temperature profile. |
 |
18 September 2008
|
Instrument: VIRTIS
Description: An extensive data set collected by VIRTIS between April 2006 and July 2007 has made it possible to derive the wind profiles in the cloud layers at three different altitudes, for the entire southern hemisphere. |
 |
30 May 2008
|
Instrument: VIRTIS
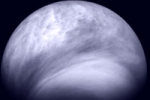
Description: Global and detailed images of cloud features on Venus obtained at ultraviolet wavelengths (365 nm) are presented. They clearly show the variation of cloud structures with latitude. |
 |
15 May 2008
|
Instrument: VIRTIS
Description: The VIRTIS instrument has made the first detection of hydroxyl (OH) in the atmosphere of Venus. The OH is unambiguously identified in the 1.40-1.49 μm and 2.6-3.14 μm bands. This is the first detection of OH in the atmosphere of a planet other than Earth. |
 |
13 March 2008
|
Instrument: VIRTIS
Description: Video sequence of ten images taken over a period of five hours at half-hourly intervals on 7 April 2007, showing the south polar vortex at a wavelength of 3.9 µm. The camera point of view is co-rotating with the vortex, keeping its orientation stationary in this sequence. The vortex is very complex, with atmospheric gases flowing in different directions at different altitudes. |
 |
4 February 2008
|
Instrument: VIRTIS
Description: Spectra of Venus' atmosphere below the thick global cloud layers (47-68 km altitude) reveal with improved accuracy the distribution of minor chemical species in the altitude range 30-40 km. |
 |
3 September 2007
|
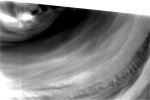
Instrument: VIRTIS
Distance: 50 000 - 65 000 km
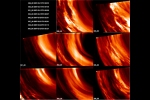
Description: A sequence of eight images at 2.3 μm from eight orbits in February 2007 shows the difference in atmospheric flow characteristics on Venus as a function of latitude. |
 |
19 July 2007
|
Instrument: VIRTIS
Distance: 35 000 km
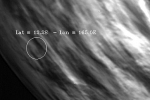
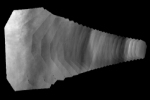
Description: Image at 2.3 μm of Venus's atmospheric region over which NASA's MESSENGER passed on 5 June 2007 (closest approach is marked with the circle). |
 |
|
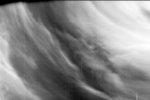
Instrument: VIRTIS
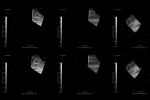
Description: Set of images at 1.7 μm of the region that NASA's MESSENGER passed on 5 June 2007, taken before and after closest approach of the flyby. At this wavelength atmospheric details are seen down to an altitude of 50 km. |
 |
|
Instrument: VIRTIS
Description: Sequence of images obtained on 5 and 6 June 2007, before and after MESSENGER's closest approach to Venus. The images were obtained at 1.7 μm and show atmospheric details down to an altitude of 50 km.
|
 |
|
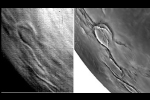
Instrument: VIRTIS
Description: Comparison of an unprocessed thermal map of the Venusian surface from VIRTIS on 5 June 2007 (left) and a radar image of the same area obtained by NASA's Magellan spacecraft in the early 1990s (right).
|
 |
7 May 2007
|
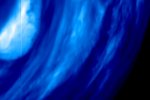
Instrument: VIRTIS
Description: Sequence of false-colour images at 3.8 µm (red) and 1.7 µm (blue) of the south-polar region, taken between 7 and 11 April 2007. The observations allowed imaging of both the day and night side simultaneously, at different depths in the atmosphere. |
 |
|
Instrument: VIRTIS
Description: Same sequence of images as above, but with the images now edge-enhanced to reveal structure details. The images were obtained during ~8 hours per orbit. |
 |
11 April 2007
|
Instrument: VIRTIS
Distance: ~ 65 000 km
Description: Two false-colour views of the Venus oxygen airglow (at 1.27 µm, blue) superimposed over a 1.7 µm image obtained on 26 August 2006. The two views only differ in the colour scaling, to reveal different details. |
 |
|
Instrument: VIRTIS
Distance: ~ 68 000 km
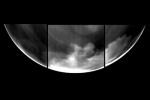
Description: Composite of three images at 1.27 µm of Venus's night side. At this wavelength, oxygen airglow can be detected and appears as the bright patchy regions and as the bright limb in this view. |
 |
|
Instrument: VMC
Distance: 25 000 - 60 000 km
Description: Video of six different image sequences obtained at 367 nm (UV) on 21 & 24 May 2006, 27 December 2006, and on 3, 4 & 6 January 2007 respectively, showing the upper cloud deck as well as a bright haze above it. |
 |
|
Instrument: -
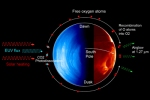
Description: Schematic of oxygen airglow production. Photo-dissociation of CO2 in the upper atmosphere on Venus's day side releases oxygen atoms that recombine on the night side, producing the O2 airglow. |
 |
3 April 2007
|
Instrument: VIRTIS
Distance: 37 000 - 65 000 km
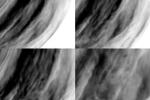
Description: Four different views of the Venusian cloud system, acquired on 24 September 2006 at 1.7 μm to allow viewing of the deep atmospheric layers. Bright regions correspond with a higher cloud concentration. |
 |
14 December 2006
|
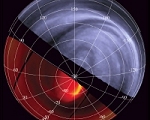
Instrument: VIRTIS
Description: Temperature map of the Venusian surface based on data gathered on 10 August 2006, at 1.02, 1.10 & 1.18 μm during orbit 112 by VIRTIS (left), compared with predictions based on the Magellan topographic data obtained in the early 1990s (right). |
 |
13 November 2006
|
Instrument: VIRTIS
Distance: ~60 000 km
Description: False-colour image of area close to the south pole imaged at 1.7 µm, revealing the differences in cloud cover thickness and the thermal emission coming through the clouds. |
 |
|
Instrument: VIRTIS
Distance: ~64 000 km
Description: Monochrome image of the south polar region imaged at 1.7 µm, showing the distinctive pattern of cloud wave structure at around 55° southern latitude. |
 |
20 October 2006
|
Instrument: VIRTIS
Distance: ~ 65 000 km
Description: Composite of three false-colour images of Venus's night side at 1.7 µm, taken 30 minutes apart. Bright regions correspond to less cloud cover resulting in more radiation from lower altitudes to pass through. |
 |
|
Instrument: VIRTIS
Distance: ~ 65 000 km
Description: Negative image of a VIRTIS observation of the Venus night side at 2.3 µm. By taking the negative image, bright regions now represent the areas of more cloud cover. |
 |
12 July 2006
The images in this data set were all gathered during the early mission phase between mid-May and end of April 2006.
|
Instrument: VMC
Distance: 39 100 to 22 600 km
Description: This false colour movie was built with ultraviolet images taken at 365 nanometres on 22 May 2006, while Venus Express was flying over the northern hemisphere approaching the planet. |
 |
|
Instrument: VMC
Distance: 39 100 to 22 600 km
Description: This greyscale movie was built with ultraviolet images taken at 365 nanometres on 22 May 2006, while Venus Express was flying over the northern hemisphere approaching the planet. |
 |
|
Instrument: VMC
Distance: 7505 - 1570 km
Description: Movie built with ultraviolet images taken on 24 April 2006. Ultraviolet markings on the cloud top, caused by as yet unidentified UV absorbers, are visible as darker features. |
 |
|
Instrument: VMC
Distance: 7505 - 1570 km
Description: Mosaic of images taken at 365 nanometres on 24 April 2006, flying over the northern hemisphere. |
 |
|
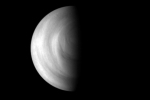
Instrument: VMC
Distance: ~ 66 500 km
Description: Venus's southern hemisphere, observed in the ultraviolet at 365 nanometres. Near the pole, spiralling clouds are observed surrounding the polar vortex. |
 |
|
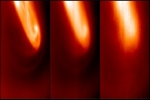
Instrument: VIRTIS
Distance: ~ 64 000 km
Description: Close-up view of Venus's south polar vortex at three infrared wavelengths, corresponding to different atmospheric depths. The difference in contrast and structure is readily apparent. |
 |
|
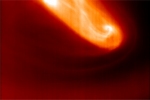
Instrument: VIRTIS
Distance: ~ 64 000 km
Description: Movie of close-up images of the double-eyed south polar vortex taken at 5.05 µm. This wavelength reveals cloud structure at ~59 kilometres altitude. |
 |
|
Instrument: VIRTIS
Distance: ~ 64 000 km
Description: Movie showing the same region over the south polar vortex but at different infrared wavelengths between 4.5 and 5.1 µm, allowing to see emission from different altitudes. |
 |
|
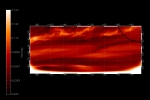
Instrument: VIRTIS
Description: Large map of Venus's night side, as observed at 1.7 µm on 12 April 2006, during Venus Express's first orbit around the planet - capture orbit. This type of images are used for measuring the wind speed. |
 |
|
Instrument: VIRTIS
Distance: 6000 - 20 000 km
Description: Composite of two images taken at 2.3 µm (left) and 1.7 µm (right) showing fine atmospheric structure below the Venusian cloud deck. |
 |
|
Instrument: VIRTIS
Distance: 6000 - 20 000 km
Description: Geographical projection of a set of observations at 1.7 µm. The difference in observing distances is reflected in the level of observed detail. |
 |
|
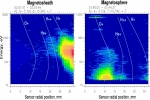
Instrument: ASPERA
Description: The left plot shows the heated solar wind (protons and alpha-particles), which just passed the Venus bow shock. The right plot shows massive escape of planetary oxygen ions. |
 |
27 June 2006
This set of results from Venus Express come from data collected during the first orbit around Venus, the highly elliptical capture orbit. Observations were made at different distances from Venus, for a few hours each time on six different slots between 12 and 19 April 2006. The most striking results are the observations of the south polar double vortex, which has for the first time been imaged at this level of detail.
|
Instrument: VIRTIS
Distance: 190 000 - 315 000 km
Description: Movie of false-colour images at 5 µm, showing Venus's southern hemisphere and the evolution of the south polar vortex. The day side is yellow (bright) and the night side is blue (dark). |
 |
|
Instrument: VIRTIS
Distance: 190 000 - 315 000 km
Description: Infrared images at 5 µm of the Venus southern hemisphere, clearly showing the double vortex at the south pole. Same colour scheme as the above movie. |
 |
|
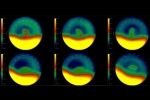
Instrument: VIRTIS
Distance: 190 000 - 315 000 km
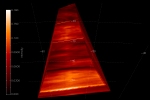
Description: Set of images at 5 µm of the Venus southern hemisphere. The brightest area is from reflecting sunlight. The south polar double vortex is visible mainly on the night side (at left) in these images. |
 |
|
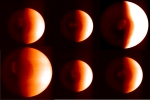
Instrument: VIRTIS
Distance: 190 000 km
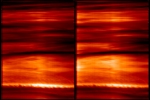
Description: Venus at 380 nm. At this wavelength atmospheric stripe-like structures are observed on the planet's day side, the nature of which is as yet unexplained. |
 |
|
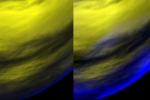
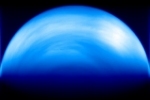
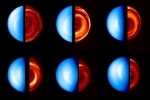
Instrument: VIRTIS
Distance: 190 000 - 315 000 km
Description: Composite views of Venus in ultraviolet at 380 nm (left side, blue colour scheme) and infrared at 1.7 µm (right side, red colour scheme). The right side shows thermal radiation from the different cloud layers. |
 |
7 June 2006
|
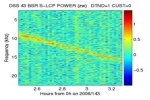
Instrument: VeRa
Description: This plot shows the radio spectrum reflected off Venus's surface around the transmitter frequency emitted by the High Gain Antenna, during the first bistatic radar measurements on 23 May 2006. |
 |
Last Update: 1 September 2019
