Direct observation of 3D magnetic reconnection
4 February 2005
Magnetic reconnection on the Earth's magnetopause is considered to be the most efficient mechanism for solar material to penetrate the Earth's magnetic shield. Complex geometrical properties of a transient and spatially confined type of reconnection have been observed in the past but so far not explained, due to high velocity of the magnetopause and the use of single spacecraft measurements. Published 8 October 2004, in Geophysical Research Letters, a case study based on multipoint measurements by the Cluster mission reveals, for the first time, a direct observation of a 3D magnetic field topology at the magnetopause, resulting from magnetic reconnection at multiple sites, which could explain these geometrical properties. It also shows a direct view of the entry of particles through the magnetopause.
 |
 |
|
Image 1: Artistic view of the solar wind blown away continuously by the Sun.(Copyright: ESA) |
Animation 1: Sketch of the Earth's magnetosphere, with reconnected field lines (in white) propagating tailward.(Acknowledgements: N. Tsyganenko, USRA/GSFC/NASA) |
Every second, on average, the Sun is blowing away 1 billion kilograms of electrons, protons, and denser matter, in all directions (Image 1). Approaching Earth at supersonic speed (typically ~ 400 kms-1), this solar wind is first decelerated by a boundary layer called the bow shock.
Then, to a first approximation, the solar wind gets deflected by the Earth's internal magnetic field, much like air streaming around a car. The Earth's magnetic sphere of influence (the car) is called the magnetosphere. The boundary layer (the carossery) separating the magnetosphere from the solar wind is called the magnetopause.
The magnetopause, however, is certainly not an impenetrable shield. Cracks in the Earth's magnetic shield can occur when magnetic field lines of the Earth interconnect with Interplanetary Magnetic Field (IMF) lines (carried by the solar wind). This topological change of the magnetic field allows solar material to enter. This phenomenon, known as magnetic reconnection, was imagined in the 50's as a large scale steady-state process, as illustrated by Animation 1. In the late 70's, a transient and spatially confined type of reconnection was identified: the magnetic flux transfer events (FTE). Complex geometrical properties of FTE were found but so far not explained.
In the 80's and 90's, theoretical studies proposed models to explain these observations. Some of them suggested the occurrence of reconnection at multiple sites, implying the reconfiguration of the magnetic field into a specific 3D magnetic topology. However, no direct observation of any 3D magnetic configuration, resulting from reconnection, has been performed so far at the magnetopause.
We report here the first direct observation of a 3D magnetic configuration, resulting from reconnection at multiple sites, at the dawn tail side of the magnetopause; together with a direct view of the entry of ions through the shield.
This observational premiere has been achieved thanks to the measurements of the four spacecraft of the Cluster mission, a project of international collaboration between ESA and NASA. Going back to the car analogy, if the magnetosphere were a car, it would definitely be equipped with a sunroof. Thanks to this recent study on magnetic reconnection, we now see much better how it opens.
Before presenting this new achievement of the Cluster mission, lets first step back to underline the importance of this result and also understand why it has never been observed before.
The transport of mass, but also energy and momentum, across the magnetopause is a cental issue in space physics. Consequences of this transport are of major concern for space weather specialists worldwide, monitoring our Earth's space environment and technology infrastructure. This monitoring is performed through a wide variety of satellites and ground-based measurements. One long-term goal is to accurately forecast the occurrence of solar storms and their consequences on critical technology infrastructure both in space and on Earth.
Indeed, magnetic storms, like the Halloween storm in 2003 (see also the "Solar Storms October/November 2003" news from 29 October 2003), have the potential to severely impair critical technology infrastructure. Consequences of geomagnetic storm activity can include widespread power failures, pipeline corrosion, the shutdown of cable systems, satellite failures, inaccurate GPS positioning and radio navigation.
To reach that goal, the knowledge on how, where and under which solar wind conditions, solar material penetrates the Earth's magnetic shield is of crucial importance.
The Dynamic Magnetopause
A fundamental reason why such a 3D magnetic field topology has never been observed before is the highly dynamic nature of the magnetopause position.
In the direction of the Sun, the magnetopause "nose" is located at about 10 RE from the Earth's center (1 RE = 6378 km - the Earth's equatorial radius), which is about 1/6th of the distance to the moon. The distance to the flanks abreast of the Earth is about 15 RE (Animation 2). However, these distances are just averages.
Spacecraft measurements in the early 60's revealed that the magnetopause is always moving. This motion is due to a continuous variation of the IMF direction and the (solar wind) dynamic pressure*. Animation 2 and animation 3 illustrate this point.
 |
 |
|
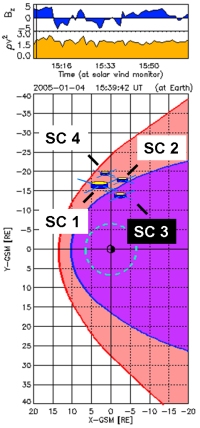
Animation 2 (left): Top panel: z-component of the IMF (Bz), displayed in blue, and the dynamic pressure (ρv2), displayed in orange, measured by the ACE spacecraft in the solar wind on 4 January 2005 (see text for details). Bottom panel: magnetopause position (blue line) and bow shock position (bright red line) estimated from the solar wind data as displayed in the top panel. Pink area between these two borders depicts the magnetosheath, while the purple area symbolises the magnetosphere. The dashed green circle, located at 6.6 RE, depicts where many communication and weather satellites orbit the Earth.(Acknowledgments: S.M. Petrinec, Lockheed Martin) Animation 3 (right): Same type as Animation 2 but for solar wind measurements on 8 June 2000. (Acknowledgments: S.M. Petrinec, Lockheed Martin) | |
Both animations are based on the same theoretical models, which estimate the shape and location of the bow shock (red line) and the magnetopause (dark blue line) from solar wind data, including: the z-component of the IMF (Bz) and the dynamic pressure P=ρv2). These quantities, displayed in the top panel of each animation, have been recorded by the ACE spacecraft, on 4 January 2005 (Animation 2) and 8 June 2000 (Animation 3).
In the bottom panel of each animation, the Earth is displayed in the center, illuminated from the left by the Sun (not shown). In this view, we are looking down at the equatorial plane, upon the North Pole. The geosynchronous orbit at 6.6 RE, where many weather and communication satellites orbit, is depicted by a green dashed circle.
Animation 2 is characteristic of quiet solar wind conditions (-5 nT < Bz < 5 nT and P < 3 nPa). During the whole hour of measurements, the estimated position of the magnetopause nose is located at about 10 RE (x-axis), while the distance to the flanks abreast of the Earth is about ±15 RE (y-axis). Variations observed in the solar wind are manifested as "waves" along the bow shock and the magnetopause.
 |
|
Image 2: Rough positions of all four Cluster spacecraft moving along the magnetopause on 30 June 2001 between 5 and 6 UT. SC3 is located in the magnetosphere, while the other 3 Cluster spacecraft are located in the magnetosheath. (Acknowledgments: S.M. Petrinec, Lockheed Martin) |
On the contrary, disturbed solar wind conditions occur during animation 3 (-23 nT < Bz < 23 nT and 2 < P < 17 nPa). At the beginning of this animation, solar wind conditions are similar to those of animation 2. The estimated magnetopause position is thus located at ~10 RE on the dayside and ~15 RE to the flanks abreast of the Earth. As the dynamic pressure ramps up, the magnetopause is compressed towards the Earth and even beyond geosynchronous orbit. Meanwhile, the IMF Bz clearly turns southward, indicative of large-scale magnetic reconnection (see also "Spatial scale of high-speed flows in the magnetotail").
Statistical analyses of magnetopause crossings have estimated the magnetopause velocity between 10 kms-1 and 80 kms-1 in most instances. This motion is much more rapid than the velocity of a scientific spacecraft (~ 5 kms-1) and therefore complicates the study of magnetopause crossings. In such a case, when measurements from only one spacecraft are available, a measured temporal profile is indeed difficult to convert into a spatial profile.
Various processes have been proposed to account for the penetration of solar plasma, through this highly dynamic boundary layer:
- reconnection between the interplanetary magnetic field and the Earth's magnetic field
- impulsive penetration, where plasma filaments, which have a higher momentum than the surrounding solar wind plasma, hit and possibly penetrate through the magnetosphere
- viscous interaction
Distinguishing between these processes is far from simple and not only because of the magnetopause motion. Spatial scales of this phenomenon indeed range from hundred meters to several Earth radii. Other features such as plasma density, time scales and wave phenomena exhibit similar ranges in variation. In other words, the penetration of solar material through the magnetopause is truly a multiscale phenomenon.
Cluster Observations
For all these reasons, multi-spacecraft measurements are necessary to study the dynamics of the magnetopause. Launched in 2000, the multi-spacecraft Cluster mission allows for the first time to study, among other magnetospheric boundary layers, the magnetopause, in 3 dimensions and over different spatial scales. Cluster is composed of four identical spacecraft flying in formation, with a flexible inter-spacecraft separation, modified several times since launch (from 100 km to 5000 km).
 |
 |
|
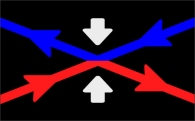
Animation 4: In a plasma, during magnetic reconnection, magnetic field lines of opposite direction break and then reconnect, forming an X-line magnetic topology. The newly reconnected field lines accelerate the plasma away from the X-line. (Animation created by the Center for Visual computing, University of California Riverside) |
Image 3: X-line magnetic topology during magnetic reconnection. |
On 30 June 2001, the Cluster spacecraft were straddling the magnetopause in the dawn sector, under quiet solar wind conditions and a slightly northward IMF. The magnetopause was found to be located between the SC3 satellite in the magnetosphere and the three other Cluster spacecraft in the magnetosheath (SC1, SC2 and SC4). Rough positions of all Cluster spacecraft, projected in the equatorial plane, are displayed on Image 2.
As mentioned in the introduction, magnetic reconnection temporally modifies the magnetic field topology, which then allows plasma to flow across the magnetopause. Illustrating the basic mechanism of reconnection helps to understand the topological change detected by Cluster. The mechanism can be accurately described in 2 dimensions (2-D) and is depicted by Animation 4.
In a plasma, magnetic field lines of opposite direction can break and then reconnect, forming an X-line magnetic topology (Image 3). The location of such an X-line is called a reconnection site. The release in the magnetic stress of the newly reconnected field lines accelerates the plasma away from the X-line (like the release of the tension force of a rubber band).
The occurrence of a single X-line topology can be tested on magnetic field measurements, by means of the so-called Walén test. This test is based on 2-D fluid hypotheses.
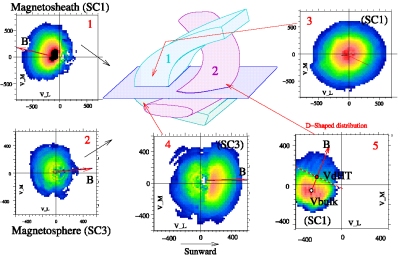
Plasma flow across the magnetopause can also be tested on satellite measurements. In particular, ion distributions on reconnected field lines consist of a mixture of magnetosheath and magnetospheric population, where the transmitted magnetosheath population has a "D-shaped" distribution with a low-energy cut-off (lower right panel of Image 4).
On 30 June 2001, during undisturbed time intervals, the angle between the magnetospheric (SC3) and the magnetosheath (SC1, SC2, SC4) magnetic field was ~170°. In other words, magnetic field lines, on each side of the magnetopause, were almost in opposite direction.
From 0500 to 0600 UT, this quasi-ideal 2D magnetopause was perturbed several times and each time during a few minutes. For every disturbed period, rotation of the magnetic field together with significant density variations is observed.
 |
|
Image 4: 3-D scenario of the inter-linked magnetic configuration and conjugate observations of ion distributions by the CIS instrument of Cluster spacecraft 1 and Cluster spacecraft 3. For reference, distributions 1 and 2 are typical of measurements made around 0510 UT on opposite sides of the nominal quasi-impermeable magnetopause. In flux tube 1, SC1 observes a hot (~330 eV), isotropic and dense (~10 cm-3) plasma ‘bubble' (distribution 3, at 0512:44). These are decelerated magnetosheath particles associated with the transient reconnection. On the magnetospheric side of structure 1 (distribution 4), SC3, magnetically connected to the bubble, measures a hot population (6 cm-3, ~360 eV, at 0514) moving in the solar direction, along the local B-field. It has phase space characteristics very similar to those of distribution 3, which indicates that magnetosheath particles are entering the magnetosphere along the reconnected field lines. Distribution 5 (from SC1) displays a convincing D-shape with a cut-off at the HT velocity (dashed red line) as expected in the tailward branch of a reconnection site (Figure 4 of Louarn et al., 2004). |
All these time intervals have been investigated in detail. In particular, the Walén test was applied and the shape of the ion distributions checked.
For two time intervals, the Walén test is successful and D-shaped ion distributions are observed. In each case, these results are interpreted as the occurrence of magnetic reconnection, with a single X-line topology, upstream of the satellites.
For two other cases, the Walén test is not successful. However, D-shaped ion distributions are still observed. How is that possible? Detailed investigation of one data interval allowed Cluster scientists to conclude that a single reconnection site cannot explain the observations.
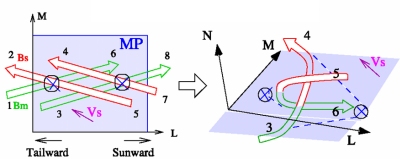
Instead, they propose that two systems of flux tubes, oriented at 90°, converging towards each other and resulting from two reconnections, have been observed by Cluster. Magnetic field topology before and after the motion are sketched in Image 5.
 |
|
Image 5: Evolution of flux tubes after multipoint reconnections in a non anti-parallel configuration. Digits mark the branches of the reconnected tubes and crosses the reconnection sites. All quantities are displayed in the boundary normal (L, M, N) frame, with N normal to the magnetopause or MP (pointing towards the magnetosheath), L in the plane containing N and the average magnetospheric field, M completing the system. The 3D view takes into account the tube deformation due to the magnetic tension and the magnetosheath motion, or Vs (Image 1 of Louarn et al, 2004). |
"This interaction could explain why the Walén test is not successful since the resulting complex magnetic configurations is far from the 2-D fluid hypotheses needed from for Walén's test applications.", wrote Dr. Philippe Louarn, lead author on this research, published 8 October 2004 in Geophysical Research Letters.
This 3D magnetic topology of inter-linked magnetic structures is recalled in the middle of Image 4, where the blue plane symbolises the magnetopause. Three measured ion distributions from SC1 and SC3, supporting this interpretation, are displayed on the right side and just below the topological sketch. Each of these distributions is linked to the 3D magnetic topology by a red arrow. For reference, the two distributions displayed on the left side of Image 4 are measurements from both sides of the nominal quasi-impermeable magnetopause; measurements performed during undisturbed time periods.
This inter-linked magnetic configuration is the first direct observation of a 3D magnetic field topology, resulting from magnetic reconnection occurring at multiple sites, at the magnetopause.
"Thanks to the four Cluster spacecraft, we have found the first direct observation of a 3D magnetic field topology, resulting from two reconnection sites at the magnetopause. The next step is now to understand the complete 3D picture of the process and the temporal evolution of the interacting flux tubes.", concluded Dr. Philippe Louarn.
Dr. Philippe Louarn is the head of the Solar System department at the Centre d'Etude Spatiale des Rayonnements (CESR), Toulouse and Co-Investigator of the Spatio-Temporal Analysis of Field Fluctuation experiment (STAFF). Experiments used for this study are the FluxGate Magnetometer (FGM) experiment, while ion distributions are obtained through the Cluster Ion Spectrometry instrument (CIS).
This new result is far from being the only one found by Cluster with regards to the transport of solar material through the magnetopause.
For the first time, (Phan et al., 2003) were able to directly relate magnetic reconnection observed by Cluster, with dayside proton auroral spots observed by the IMAGE spacecraft (see ESA PR 31-2003).
Six months later, (Frey et al., 2003) presented evidence that these spots were continuously observed for hours. In other words, cracks in the dayside magnetopause, due to reconnection, can remain open for hours, unlike previously thought. This observational first was the subject of a publication in the journal Nature on 4 December 2003, nicely illustrated by 3D animations in a dedicated NASA top story).
Another striking result is the first crossing by four spacecraft of a diffusion region, where magnetic reconnection is initiated. Using data recorded by the Cluster mission with 100 km inter-spacecraft separation, (Vaivads et al., 2004) could deduce fundamental physical properties of this region and reproduce them with numerical simulations.
Last but not least, on 13 August 2004, a case study based on Cluster measurements was published, also in Nature (Hasegawa et al., 2004), showing the first direct observation of giant gas vortices on the flanks of the magnetopause, which alternatively enables solar wind plasma to enter the magnetosphere (ESA, SNR 19-2004).
In the near future, the analysis of Cluster measurements at all separation scales from 100 km to 5000 km, and 10000 km this year (June 2005), shall further illuminate our knowledge on the Earth's magnetopause dynamics.
* Solar wind dynamic pressure: proportional to the ion density (ρ) times the square of the solar wind bulk speed or v2 (see the y-axis label of the 2nd panel of Animation 2 and 3). The ion composition is assumed to be: 96% protons and 4% Helium (He++).
Louarn, P., A. Fedorov, E. Budnik, G. Fruit, J. A. Sauvaud, C. C. Harvey, I. Dandouras, H. Rème, M. C. Dunlop, and A. Balogh (2004), Cluster observations of complex 3D magnetic structures at the magnetopause, Geophys. Res. Lett., 31, L19805, doi:10.1029/2004GL020625.
Related articles
Vaivads, A., Y. Khotyaintsev, B. N. Rogers, M. André, P. Décréau, A. Retinó, G. Paschmann, T. Phan, S. C. Buchert, Structure of the magnetic reconnection diffusion region from four-spacecraft observations, Phys. Rev. Lett., 93(10), 105001-4, 2004.
Hasegawa, H., M. Fujimoto, T.-D. Phan, H. Rème, A. Balogh, M. W. Dunlop, C. Hashimoto and R. Tandokoro, Transport of solar wind into Earth's magnetosphere through rolled-up Kelvin–Helmholtz vortices, Nature, 430, 755-758, doi:10.1038/nature02799, 2004.
Frey, H. U., T. D. Phan, S. A. Fuselier, and S. B. Mende,Continuous magnetic reconnection at Earth's magnetopause, Nature, 426, 533–537; doi:10.1038/nature02084, 2003.
Phan, T. D., Frey, H. U., Frey, S., Peticolas, L., Fuselier, S., Carlson, C., Rème, H., Bosqued, J.-M., Balogh, A., Dunlop, M., Kistler, L., Mouikis, C., Dandouras, I., Sauvaud, J.-A., Mende, S., McFadden, J., Parks, G., Moebius, E., Klecker, B., Paschmann, G., Fujimoto, M., Petrinec, S., Marcucci, M. F., Korth, A., and Lundin, R. (2003), Simultaneous Cluster and IMAGE observations of cusp reconnection and auroral proton spot for northward IMF, Geophys. Res. Lett., 30, 16–1, 2003.
Related website
Online real-time magnetopause and bow shock model: http://muir.spasci.com/DynMod
Contact
Philippe Louarn, Centre d'Etudes Spatiale des Rayonnements, CNRS, Toulouse, France.
Tel: +33-5-61-55-81-01
Web story author
Arnaud Masson, SCI-SH division, RSSD, ESA, The Netherlands.
Tel: +31-71-565-5634
Web story editor
Philippe Escoubet, SCI-SH division RSSD, ESA, The Netherlands.
Tel: +31-71-565-3454
