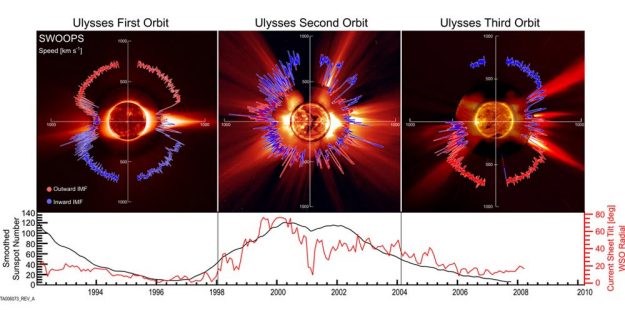
Polar plots of the solar wind speed

Date: 23 September 2008
Satellite: Ulysses
Depicts: Polar plots of the solar wind speed
Copyright: Southwest Research Institute
These radial plots of the solar wind speed combine data from all three of Ulysses' polar orbits of the sun, each of which take six years to complete. The blue coloured lines represent the outward interplanetary magnetic field; the red coloured lines the inward IMF. The first orbit occurred during solar minimum and showed slow wind over the equator and a fast wind over the poles. The second orbit showed fast and slow winds at all latitudes, consistent with solar maximum activity. Ulysses has completed more than three quarters of the third orbit, occurring around the current solar minimum cycle. While much of the data gathered thus far is consistent with typical solar minimum activity, surprisingly, it also indicates that the solar wind is about 25 percent less powerful than it was in the previous solar minimum cycle. The Sun's magnetic field flips approximately every 11 years, which explains the reversal of the red and blue IMF lines in the third orbit. A timeline and line graphs showing sunspot frequency are shown at the bottom for comparison.
The images are from the ESA/NASA Solar and Heliospheric Observatory (SOHO) and High-Altitude Observatory at Mauna Loa.
