Enceladus Fly-by - 11 August 2008
8 August 2008
On Monday, 11 August 2008, Cassini will visit Enceladus and obtain the highest resolution images to date of the moon's enigmatic south polar region. The closest approach occurs at 21:06:19 UTC at an altitude of just 54 kilometres above the moon's surface and at a relative speed of 17.7 kilometres per second. The latitude at closest approach is 28° S, the longitude is 98° W.Cassini will approach Enceladus on a fast, inclined trajectory over the northern hemisphere and will depart over the southern hemisphere. Enceladus will be in eclipse (Saturn's shadow) for ~2.5 hours starting ~36 minutes after closest-approach.
This encounter will be set up with a manoeuvre on 8 August. The Enceladus fly-by occurs on the day of orbit number 80 periapse, on the inbound leg of the orbit.
It is the fifth time in Cassini's tour of the Saturnian system that the spacecraft visits Enceladus. The previous four encounters were:
| Orbit | Date | Altitude |
| 3 | 17 February 2005 | 1175 km |
| 4 | 9 March 2005 | 500 km |
| 11 |
14 July 2005 |
175 km |
| 61 | 12 March 2008 | 52 km |
During this flyby, EN-80, the Optical Remote Sensing (ORS) instruments will perform detailed investigations of the small (~500-km diameter) but geologically active moon. In particular the ISS camera will execute a sophisticated series of images around closest approach and will obtain images of the south polar "tiger stripes" at resolutions as high as 7 m/pixel.
Science Activities
- Imaging Science Subsystem (ISS)
ISS will image the south polar terrain at up to 7 metre-scale resolution. ISS will execute a "skeet shoot" series of images to carefully balance light and smear during the closest approach of this fast fly-by. The result will be the highest-ever resolution images of the tiger stripes, and clues to what drives the jets that feed the plume. See the related links for more details on the skeet shoot sequence. - Composite Infrared Spectrometer (CIRS)
CIRS will make observations of the south polar temperatures during solar eclipse to determine the heat capacity and textural properties of the moon's regolith. These maps will complement data obtained in the previous fly-by. - Visual and Infrared Mapping Spectrometer (VIMS)
VIMS will perform compositional mapping to determine the identity of volatiles, organics, and minerals, and place them within a geological context. - Ultraviolet Imaging Spectrograph (UVIS)
The instrument will be used to obtain spectral images of Enceladus in the EUV (500-1100 Å) and FUV (1100-1900 Å) to map the surface composition, including water ice abundances and grain sizes, and will search for volatiles off the limb. - Magnetospheric and Plasma Science (MAPS)
MAPS instruments will examine the particle environment at 54 kilometres from the surface. The spacecraft will be oriented to optimize remote sensing measurements, but MAPS instruments may obtain interesting data nevertheless. The fields-and-particles instruments will eventually determine the nature of the material coming from the surface and its relationship to the E-ring. They will also distinguish between two potential populations of particles: plume particles and sputtered particles from elsewhere on the surface. The close fly-by distance will allow the magnetometer to determine whether Enceladus generates an induced magnetic field from a subsurface ocean. The magnetometer will also determine the composition of plume material from measurement of ion cyclotron waves in the magnetic field measurements.
Table of Events
8 August 2008
| Time UTC | Time wrt EN-80 |
Activity |
| 15:20:00 | -3d 06h | OTM #163 prime. Enceladus-80 approach targeting manoeuvre |
9 August 2008
| Time UTC | Time wrt EN-80 |
Activity |
| 15:20:00 | -2d 06h | OTM #163 backup |
11 August 2008
| Time UTC | Time wrt EN-80 |
Activity |
| 00:20:00 | -20h 46m | Start of SOST segment. Start of sequence S43 that contains Enceladus-80 |
| 01:05:00 | -20h 01m | Deadtime, 15 minutes long. Used to accommodate changes in fly-by time |
| 05:40:19 | -15h 26m | Medium-phase angle observation of Enceladus' plume (inbound over northern hemisphere) |
| 12:06:19 | -09h 00m | Downlink, 3 hours, to empty BBRs for Enceladus fly-by, with Madrid ground station |
| 16:06:19 | -05h 00m | Inbound ORS observations. VIMS prime - sit 'n stare; Enceladus appears 1.57-5.5 mrad across; northern hemisphere, phase angle = 100° |
| 19:36:19 | -01h 30m | Inbound ORS observations. UVIS prime - long slow scan starting off disk and ending on disk of Enceladus. Search for neutral gases |
| 20:26:19 | -00h 40m | Closest approach ORS observations. ISS prime - images of south polar terrain at resolutions of up to 7 m/pixel |
| 21:06:19 | +00h 00m | Enceladus Fly-by Closest Approach Time. Altitude = 54 km, speed = 17.7 kms-1, mid phase inbound, 110.4° phase at closest approach, mid phase outbound |
| 21:34:49 | +00h 28m | Outbound ORS observations. CIRS prime - temperature maps of tiger stripes at south pole. Enceladus goes into eclipse at 21:41 UTC |
12 August 2008
| Time UTC | Time wrt EN-80 |
Activity |
| 01:06:19 | +04h 00m | Outbound ORS observations. VIMS prime - sit 'n stare; Enceladus appears 2.2-1.85 mrad across; southern hemisphere, phase angle = 88° |
| 02:06:19 | +05h 00m | Downlink, 5 hours, with Canberra and Madrid ground stations |
| 08:06:19 | +11h 00m | Outbound ORS observations. UVIS prime - final long distant observation to map out the neutral oxygen around Enceladus |
| 13:33:19 | +16h 27m | Deadtime, 15 minutes long. Used to accommodate changes in fly-by time |
| 15:04:00 | +17h 58m | Downlink, 9 hours, Goldstone 70M |
Observation Results
Cassini Instrument: Imaging Science Subsystem (ISS)
|
Date: 19 September 2008 Credit: NASA/JPL/Space Science Institute Image Notes: Images taken using red, green and blue spectral filters were combined in this view of Enceladus after the flyby from a distance of about 201 000 km |
 |
|
Date: 14 August 2008 Credit: NASA/JPL/Space Science Institute Image Notes: False-colour overview mosaic of narrow-angle camera images taken after closest approach, showing the south polar surface fractures (tiger stripes) |
 |
|
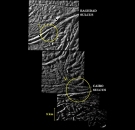
Date: 14 August 2008 Credit: NASA/JPL/Space Science Institute Image Notes: Mosaic of first 5 skeet shoot* images, scaled at 14.5 m/pixel. Two earlier identified hotspot positions are indicated on Baghdad Sulcus and Cairo Sulcus, two of the main surface fractures |
 |
|
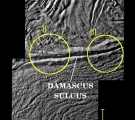
Date: 14 August 2008 Credit: NASA/JPL/Space Science Institute Image Notes: Mosaic of last 2 skeet shoot* images, with 2 earlier identified hotspot positions indicated on Damascus Sulcus, one of the main surface fractures |
 |
|
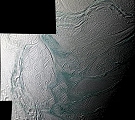
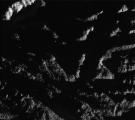
Date: 12 August 2008 Credit: NASA/JPL/Space Science Institute Image Notes: 1st of 7 skeet shoot* images of the tiger stripes in the south polar region taken by the narrow-angle camera. Image scale ~10 m per pixel. |
 |
|
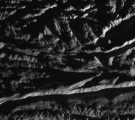
Date: 12 August 2008 Credit: NASA/JPL/Space Science Institute Image Notes: 3rd of 7 skeet shoot* images of the tiger stripes in the south polar region taken by the narrow-angle camera. Image scale ~18 m per pixel. |
 |
|
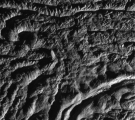
Date: 12 August 2008 Credit: NASA/JPL/Space Science Institute Image Notes: 4th of 7 skeet shoot* images of the tiger stripes in the south polar region taken by the narrow-angle camera. Image scale ~20 m per pixel. |
 |
|
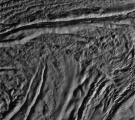
Date: 12 August 2008 Credit: NASA/JPL/Space Science Institute Image Notes: 7th of 7 skeet shoot* images of the tiger stripes in the south polar region taken by the narrow-angle camera. Image scale ~30 m per pixel. |
 |