Payload Module
Summary
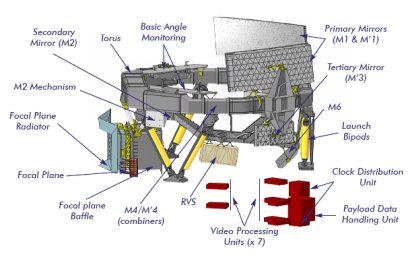
The payload consists of a single integrated instrument that comprises three major functions. In the earlier spacecraft designs, the three functions were distributed over three separate instruments. Now the three functions are built into a single instrument by using common telescopes and a shared focal plane:
- The Astrometric instrument (ASTRO) is devoted to star angular position measurements, providing the five astrometric parameters:
- Star position (2 angles)
- Proper motion (2 time derivatives of position)
- Parallax (distance)
- The Photometric instrument provides continuous star spectra for astrophysis in the band 320-1000 nm and the ASTRO chromaticity calibration
- The Radial Velocity Spectrometer (RVS) provides radial velocity and high resolution spectral data in the narrow band 847-874 nm
Each function is achieved within a dedicated area on the focal plane. Afocal elements are located close to the focal plane for the photometric and spectroscopic functions, providing dispersion of the star's spectrum along the scan. This allows both functions to take benefit from the two viewing directions and from the large ASTRO aperture, and to operate in densely populated sky areas. RVS is implemented as a grating plate, combined with four prismatic spherical lenses. This allows the necessary dispersion value to be met while correcting most of the telescope aberrations.
 |
|
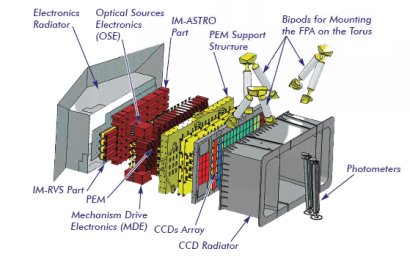
Annotated diagram of the Payload Module |
Design
The payload design is characterised by:
- A dual telescope concept, with a common structure and a common focal plane. Both telescopes are based on a three-mirror anastigmat (TMA) design. Beam combination is achieved in image space with a small beam combiner, rather than in object space as was done in the Hipparcos satellite. This saves the mass of the beam combiner, simplifies the accommodation and eliminates the directional ambiguity of the detected targets
- The use of silicon-carbide (SiC) ultra-stable material for mirrors and telescope structure provides low mass, isotropy, thermo-elastic stability and dimensional stability in a space environment. This allows to meet the stability requirements for the basic angle between the two telescopes with a passive thermal control instead of an active one
- A highly robust Basic Angle Measurement system
- A large common focal plane shared by all instruments
Optics
Gaia contains two identical telescopes, pointing in two directions separated by a 106.5° basic angle and merged into a common path at the exit pupil. The optical path of both telescopes is composed of six reflectors (M1-M6), the last two of which are common (M5-M6). Both telescopes have an aperture of 1.45m × 0.5m and a focal length of 35m. The telescope elements are built around the hexagonal optical bench with a ~3m diameter, which provides the structural support.
 |
|
Diagram of the hexagonal optical bench and the mirror system, together with the focal plane. |
Although the optical design is fully reflective, based on mirrors only, diffraction effects with residual aberrations induce systematic chromatic shifts of the diffraction images and thus of the measured star positions. This effect, usually neglected in optical systems, is also critical for Gaia. These systematic chromatic displacements will be calibrated as part of the on-ground data analysis using the colour information provided by the photometry of each observed object.
Astrometry
The main objective of the astrometric instrument (ASTRO) is to obtain accurate measurements of the relative positions of all objects that cross the fields of view of Gaia's two telescopes. The two fields of view are combined onto the single focal plane.
During its five-year mission Gaia will systematically scan the whole sky and will have obtained some 70 sets of relative position measurements for each star. These permit a complete determination of each star's five basic astrometric parameters: two specifying the angular position, two specifying the proper motion, and one - the parallax - specifying the star's distance. The five-year long mission also permits the determination of additional parameters, for example those relevant to orbital binaries, extra-solar planets, and solar-system objects.
By measuring the instantaneous image centroids from the data sent to ground, Gaia measures the relative separations of the thousands of stars simultaneously present in the combined two fields. The spacecraft operates in a continuously scanning motion, such that a constant stream of relative angular measurements is built up as the fields of view sweep across the sky. High angular resolution (and hence high positional precision) in the scanning direction is provided by the large primary mirror of each telescope. The wide-angle measurements provide high rigidity of the resulting reference system.
Design
The astrometric instrument (ASTRO) comprises the two telescopes and the dedicated area of 62 CCDs in the focal plane, where the two fields of view are combined onto the astrometic field (AF). The CCDs each are read out in TDI (time-delayed integration) mode, synchronised to the scanning motion of the satellite. In practice, stars entering the combined field of view first pass across the column of Sky Mapper (SM) CCDs, where each object is detected. Information on an object's position and brightness is processed on board in real-time to define the windowed region around the object to be read out by the following CCDs.
On-ground Data Processing
The a posteriori on-ground data processing is a highly complex task, linking all relative measurements and transforming the location (centroiding) measurements in pixel coordinates to angular field coordinates through a geometrical calibration of the focal plane, and subsequently to coordinates on the sky through calibrations of the instrument attitude and basic angle.
Further necessary corrections to be performed include those for optics effects (systematic chromatic shifts and abberation) and general-relativistic effects (light bending due to the Sun, the major planets plus some of their moons, and the most massive asteroids).
Accuracy
The accuracy of the measurements depends on the stellar type and relies on the stability of the basic angle of 106.5° between the two telescopes. This angle is monitored by the Basic Angle Monitoring (BAM) system.
| Astrometric performance (parallax error) | ||||
| Stellar type | V mag | σ(π) μas | ||
| B1V |
|
|
||
|
|
|||
|
|
|||
| G2V |
|
|
||
|
|
|||
|
|
|||
| M6V |
|
|
||
|
|
|||
|
|
|||
Photometry
The photometer will measure the spectral energy distribution (SED) of all the detected objects. This will serve two goals:
- From the SED measurements, astrophysical quantities such as luminosity, effective temperature, mass, age, and chemical composition are derived
- In order to meet the astrometric performance requirements, the measured centroid positions must be corrected for systematic chromatic shifts induced by the optical system. This is only possible with the knowledge of the spectral energy distribution of each observed target in the wavelength range covered by the CCDs of the main astrometric field (~320-1000 nm)
Design
The photometer (like the spectrometer) is merged with the astrometric function, using the same large collecting apertures of the two telescopes. The photometry function is achieved by means of two low dispersion optics located in the common path of the two telescopes: one for the short wavelengths (BP) and one for the long wavelengths (RP).
| Blue Photometer (BP) | 320-660 nm |
| Red Photometer (RP) | 650-1000 nm |
The baseline design uses only one prismatic element in fused silica for each photometer, to disperse the collected light along scan prior to detection.
The prisms are located at the nearest possible position from the focal plane, in order to facilitate the mechanical holding and moreover reduce the shadowed areas. Both prisms are attached to the box shaped CCD radiator directly in front of the detector array. Both photometers, BP and RP, have a dedicated CCD strip that covers the full astrometric field of view in the across-scan direction.
Accuracy
The spectral resolution is a function of wavelength as a result of the natural dispersion curve of fused silica; the dispersion is higher at short wavelengths.
The BP and RP dispersers will be designed in such a way that BP and RP spectra have similar sizes (on the order of 30 pixels along scan). BP and RP spectra will be binned on-chip in the across-scan direction; no along-scan binning is foreseen. For bright stars, single-pixel-resolution windows are foreseen to be used, in combination with TDI gates.
The end of mission sky averaged magnitude standard error will depend on the star type, magnitude and wavelength band and it will typically be in the range of 10-200 × 10-3 in magnitude.
Spectrometry
Objectives
The primary objective of Gaia's Radial Velocity Spectrometer (RVS) instrument is the acquisition of radial velocities. These line-of-sight velocities complement the proper-motion measurements provided by the astrometric instrument. To this end the instrument will obtain spectra in the narrow near infrared band [847-874 nm] with a resolution of 11 500.
The RVS wavelength range, 847-874 nm, has been selected to coincide with the energy-distribution peaks of G- and K-type stars which are the most abundant RVS targets. For these late-type stars, the RVS wavelength interval displays, besides numerous weak lines mainly due to Fe, Si, and Mg, three strong ionised calcium lines (at around 849.8, 854.2, and 866.2 nm). The lines in this triplet allow radial velocities to be derived, even at modest signal-to-noise ratios. In early-type stars, RVS spectra may contain weak lines such as Ca II, He I, He II, and N I, although they will generally be dominated by Hydrogen Paschen lines.
Design and Operations
The RVS instrument is a near-infrared, medium-resolution, integral-field spectrograph dispersing all the light entering the field of view. It is integrated with the astrometric and photometric functions and uses the common two telescopes.
| Wavelength range | 847 - 874 nm |
| Resolution (R = λ/Δλ) | ~ 11 500 |
RVS uses the Sky Mapper function for object detection and confirmation. Objects will be selected for RVS observation based on measurements made slightly earlier in the Red Photometer. Light from objects coming from the two viewing directions of the two telescopes is superimposed on the RVS CCDs.
The spectral dispersion of objects in the field of view is achieved by means of an optical module physically located between the last telescope mirror (M6) and the focal plane. This module contains a grating plate and four dioptric, prismatic, spherical, fused-silica lenses which correct the main aberrations of the off-axis field of the telescope. The RVS module has unit magnification which means that the effective focal length of the RVS equals 35 m.
 |
|
Location of the RVS optical module and detectors. |
Spectral dispersion is oriented in the along-scan direction. A dedicated passband filter restricts the throughput of the RVS to the desired wavelength range.
The RVS-part of the Gaia focal plane contains 3 CCD strips and 4 CCD rows. Each source will typically be observed during ~40 field-of-view transits throughout the 5-year mission. On the sky, the RVS CCD rows are aligned with the astrometric and photometric CCD rows; the resulting semi-simultaneity of the astrometric, photometric, and spectroscopic transit data will be advantageous for variability analyses, scientific alerts, spectroscopic binaries, etc. All RVS CCDs are operated in TDI (time-delayed integration) mode.
The RVS spectra will be binned on-chip in the across-scan direction. All single-CCD spectra are foreseen to be transmitted to the ground without any further on-board (pre-)processing. For bright stars, single-pixel-resolution windows are foreseen to be used, possibly in combination with TDI gates. It is currently foreseen that the RVS will be able to reach object densities on the sky of up to 40 000 objects deg-2.
On-ground Data Processing
Radial velocities will be obtained by cross-correlating observed spectra with either a template or a mask. An initial estimate of the source atmospheric parameters derived from the astrometric and photometric data will be used to select the most appropriate template or mask. Iterative improvements of this procedure are foreseen. For stars brighter than ~15th magnitude, it will be possible to derive radial velocities from spectra obtained during a single field-of-view transit. For fainter stars, down to ~17th magnitude, accurate summation of the ~40 transit spectra collected during the mission will allow the determination of mean radial velocities.
Atmospheric parameters will be extracted from observed spectra by comparison of the latter to a library of reference-star spectra using, for example, minimum-distance methods, principal-component analyses, or neural-network approaches. The determination of the source parameters will also rely on the information collected by the other two instruments: astrometric data will constrain surface gravities, while photometric observations will provide information on many astrophysical parameters.
Focal Plane
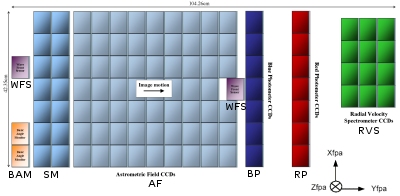
The Gaia focal plane will be the largest ever developed, with 106 CCDs, a total of almost 1 Gigapixels and physical dimensions of 0.5m × 1m. The focal plane assembly is common to both telescopes and serves five main functions (in order of occurrence):
- the wave-front sensor (WFS) and basic-angle monitor (BAM)
- the Sky Mapper (SM), which autonomously detects objects entering the fields of view and communicates details of the star transits to the subsequent CCDs
- the main Astrometric Field (AF), devoted to astrometric measurements
- the Blue and Red Photometers (BP and RP), providing low resolution spectrophotometric measurements for each object over the wavelength ranges 320-660 and 650-1000 nm, respectively
- the Radial-Velocity Spectrograph (RVS), registering spectra of all objects brighter than about 17th magnitude
The 106 detectors are distributed over the focal plane as follows:
| Function | CCDs | Details |
| Metrology and Alignment | 4 | 2 wave front sensors (WFS), 2 basic angle monitoring (BAM) CCDs |
| Star detection | 14 | 2 × 7 sky mapper (SM) CCDs, 7 per telescope |
| Astrometry (AF) | 62 | 8 × 7, 1 × 6 |
| Photometry (BP, RP) | 14 | 7 blue and 7 red |
| Spectrometry (RVS) | 12 | 3 × 4 |
 |
|
Figure 1 The CCD array layout. The two Fields of View from both telescopes are mapped onto the array, with the imaged objects crossing the focal plane in the +yfpa direction at a constant speed of 60" s-1. |
Observation Sequence in the Focal Plane
Every object crossing the focal plane is first detected either by SM1 or SM2. These record respectively the objects only from telescope 1 or 2. This is achieved by a mask that is placed in each telescope intermediate image in the across scan direction (parallel to the detector column).
Next, a surrounding window is allocated to the object and is propagated through the following CCDs of the row as the imaged object crosses the focal plane.
The object is confirmed by the detectors in the first column of the Astrometric Field (AF1) for eliminating false detections (cosmic rays).
The object then progressively crosses the 8 next AF columns, followed by the BP, RP and RVS detectors. The spacecraft's accurate attitude control provides the position of the imaged object versus time, which is used for operating the detectors along the line in windowing mode. This reduces the readout noise to a few electrons.
The nominal integration time per CCD is 4.42 seconds, corresponding to 4500 pixels along scan. For bright saturating objects, the integration time in AF1-AF9, BP and RP is reduced by activating electronic TDI gates in the detector over a short period corresponding to the bright star window. The purpose of the TDI gates is to lower the effective number of pixels along scan. Twelve gates are available in the detector and allow optimising the signal collection for bright stars at the minimum expense for faint stars.
CCD characteristics
All CCDs have the same format and are derived from e2v Technologies design and are large-area, back-illuminated, full-frame devices. They are operated in Time Delay Integration (TDI) mode with a TDI period of 982.8 μs.
| pixel size along scan |
10 μm |
| pixel size across scan | 30 μm |
| # of pixels along scan | 4500 |
| # of pixels across scan | 1966 |
| Operational temperature | -115 °C |
The Focal Plane Assembly
The focal plane is passively cooled to 170 K for reducing its sensitivity to radiation. The box shaped CCD radiator provides the radiative surface with the colder internal payload cavity (120K) as well as CCD shielding against radiation and support for the photometer prisms.
 |
|
Figure 2 The focal plane assembly, with the CCD array. Light from the telescopes comes from the right in this view. The electronics radiator on the left marks the outside of the spacecraft. |
Data Handling
Time Reference
Star localisation measurement is performed by transit detection and time measurement, which calls for a very accurate datation of object transits. For this purpose, a Clock Distribution Unit (CDU) provides all necessary timing signals and clock functions for video sample time tagging and ground based time scale correlation. All signals are generated on the basis of the highly stable central master 10 MHz Rubidium atomic clock.
Time Correlation
In addition to the classical corrected one-way path technique, it is proposed that on-board-to-UTC time correlation be performed by a specific two way process. This technique allows to cancel symmetrical delays of ionospheric or tropospheric origin, or delays of relativistic origin. This correlation performance is furthermore independent of the orbit.
On-board Payload Processing
The Payload Data Handling System (PDHS) is implemented as a set of 7 Video Processing Units (one for each detector row of the focal plane) feeding a common 800 Gbit solid state mass memory. The processing part of the PDHS has a modular architecture which follows the focal plane assembly architecture and eases the accommodation. In the case of failure of one channel, this would have little impact on the science performance. The file-organised mass memory is a standard stand-alone unit.
On-board data processing algorithms allow computations to be made in real time, without data buffering. The hardware-software share offers full flexibility and algorithms may be modified in-flight following first in-orbit results.
Metrology
A five-degrees-of-freedom static mechanism is implemented behind the secondary mirrors of the two telescopes (based on the three-mirror anastigmat design) for securing the optical performance in orbit and cancelling static residual errors due to mirror micro-settings and gravity release.
The Basic Angle Monitoring (BAM) system consists of a Fizeau interferometer, measuring fluctuations in the basic angle between the two telescopes.
