Two million stars on the move
12 April 2017
The changing face of our Galaxy is revealed in a new video from ESA’s Gaia mission. The motion of two million stars is traced 5 million years into the future using data from the Tycho-Gaia Astrometric Solution, one of the products of the first Gaia data release. This provides a preview of the stellar motions that will be revealed in Gaia's future data releases, which will enable scientists to investigate the formation history of our Galaxy.| Two million stars in our Galaxy, with their motions traced five million years into the future. Click here for details and large versions of the video. Credit: ESA/Gaia/DPAC, CC BY-SA 3.0 IGO |
Stars move through our Galaxy, the Milky Way, although the changes in their positions on the sky are too small and slow to be appreciated with the naked eye over human timescales. These changes were first discovered in the eighteenth century by Edmond Halley, who compared stellar catalogues from his time to a catalogue compiled by the astronomer Hipparchus some two thousand years before. Nowadays, stellar motions can be detected with a few years' worth of high-precision astrometric observations, and ESA's Gaia satellite is currently leading the effort to pin them down at unprecedented accuracy.
A star’s velocity through space is described by the proper motion, which can be measured by monitoring the movement of a star across the sky, and the radial velocity, which quantifies the star's motion towards or away from us. The latter can be inferred from the shift towards blue or red wavelengths of certain features – absorption lines – in the star's spectrum.
Launched in 2013, Gaia started scientific operations in July 2014, scanning the sky repeatedly to obtain the most detailed 3D map of our Galaxy ever made. The first data release [1], published in September 2016, was based on data collected during Gaia's first 14 months of observations and comprised a list of 2D positions – on the plane of the sky – for more than one billion stars, as well as distances and proper motions for a subset of more than two million stars in the combined Tycho–Gaia Astrometric Solution, or TGAS.
The TGAS dataset consists of stars in common between Gaia's first year and the earlier Hipparcos and Tycho-2 Catalogues, both derived from ESA's Hipparcos mission, which charted the sky more than two decades ago.
This video shows the 2 057 050 stars from the TGAS sample, with the addition of 24 320 bright stars from the Hipparcos Catalogue that are not included in Gaia's first data release. The stars are plotted in Galactic coordinates and using a rectangular projection: in this, the plane of the Milky Way stands out as the horizontal band with greater density of stars. Brighter stars are shown as larger circles, and an indication of the true colour of each star is also provided; information about brightness and colour is based on the Tycho-2 catalogue from the Hipparcos mission.
The video starts from the positions of stars as measured by Gaia between 2014 and 2015, and shows how these positions are expected to evolve in the future, based on the proper motions from TGAS [2]. The frames in the video are separated by 750 years, and the overall sequence covers 5 million years. The stripes visible in the early frames reflect the way Gaia scans the sky and the preliminary nature of the first data release; these artefacts are gradually washed out in the video as stars move across the sky.
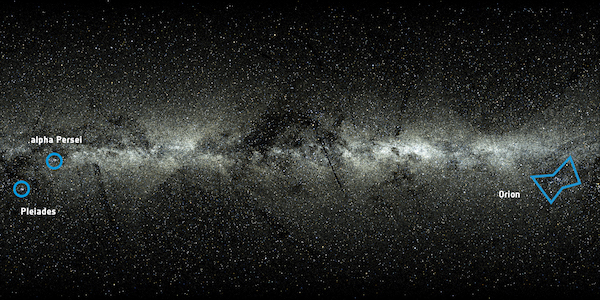 |
| The location of the Orion constellation (right) and of two stellar clusters (left) in the first frame of the video. Credit: ESA/Gaia/DPAC, CC BY-SA 3.0 IGO |
The shape of the Orion constellation can be spotted towards the right edge of the frame, just below the Galactic Plane, at the beginning of the video. As the sequence proceeds, the familiar shape of this constellation (and others) evolves into a new pattern. Two stellar clusters – groups of stars that were born together and consequently move together – can be seen towards the left edge of the frame: these are the alpha Persei (Per OB3) and Pleiades open clusters.
Stars seem to move with a wide range of velocities in this video, with stars in the Galactic Plane moving quite slow and faster ones appearing over the entire frame. This is a perspective effect: most of the stars we see in the plane are much farther from us, and thus seem to be moving slower than the nearby stars, which are visible across the entire sky.
Some of the stars appear to dart across the sky with very high velocities: for some stars, this is an effect of their close passage to the Sun – for example, in about 1.35 million years, the star Gliese 710 will pass within about 13 500 au (10 trillion kilometres) from the Sun. Other stars seem to trace arcs from one side of the sky to the other, passing close to the galactic poles, accelerating and decelerating in the process: in fact, this acceleration and deceleration are spurious effects since these stars move with a constant velocity through space.
Stars located in the Milky Way's halo, a roughly spherical structure in which the Galactic Plane is embedded, also appear to move quite fast because stellar motions in the video are calculated with respect to the moving Sun, which is located in the Galactic Plane; however, halo stars move very slowly with respect to the centre of the Galaxy.
Although this visualisation displays only the motion of stars, there is an indication in the first frame of interstellar clouds of gas and dust that block our view of more distant stars. The subsequent sequence of stellar motions shows where each star is expected to be at a given time in the future, but does not track the motion of interstellar clouds. The fact that dark clouds seem to disappear over time is a spurious effect. Similarly, the video does not predict the future positions of stars that are currently hidden by interstellar material and hence have not been observed by Gaia.
After a few million years, the plane of the Milky Way appears to have shifted towards the right: this is mainly the consequence of the motion of the Sun with respect to that of other, nearby stars in the Milky Way. However, the regions that are depleted of stars in the video will not appear as such to future observers looking at the sky from Earth: instead, they will be replenished by stars that are not part of the TGAS sample and therefore not present in this view. The Large and Small Magellanic Clouds, whose stars are not well sampled in the TGAS data, are not visible in this view.
Compiled as a taster to the much larger and more precise catalogue that will be published with Gaia's second data release, TGAS is twice as precise and contains almost 20 times as many stars as the previous definitive reference for astrometry, the Hipparcos Catalogue. As such, it represents a major advance in terms of high precision parallaxes and proper motions.
Scientists across the world have been combining TGAS data with other stellar catalogues assembled using ground-based observations, to obtain larger samples of stars for which positions, distances and proper motions are available. Thus far, three such catalogues have been compiled: the HSOY ("Hot Stuff for One Year") catalogue, which contains the proper motions for 580 million stars, the US Naval Observatory CCD Astrograph Catalog 5 (UCAC 5), listing 100 million proper motions, and the Gaia-PS1-SDSS (GPS1) proper motion catalogue, which includes 350 million proper motions.
Gaia's second data release, in April 2018, will include not only the positions, but also distances and proper motions for over one billion stars, as well as radial velocities for a small subset of them. This will mark a new era in the field of astrometry, enabling scientists to study the past positions of stars – to explore the formation history of our Galaxy – and to predict their future positions to a level of accuracy that was never achieved before.
Notes
[1] Gaia’s first data release (Gaia DR1) was published on 14 September 2016. This comprised a catalogue of the positions on the sky and the brightness of more than a billion stars – the largest all-sky survey of celestial objects to date – as well as the Tycho-Gaia Astrometric Solution (TGAS), containing the distances and motions for the two million stars in common between the Gaia dataset and the Hipparcos and Tycho-2 catalogues. The TGAS dataset is twice as precise and contains almost 20 times as many stars as the previous definitive reference for astrometry, the Hipparcos Catalogue.
[2] To calculate the future positions of stars, the astrometric measurements from the TGAS dataset were combined with a sample of 235,966 radial velocity measurements from the RAVE, GALAH, and APOGEE catalogues. The calculation is based on a linear extrapolation of the measured velocities of stars, which is a reasonable first-order approximation to study stellar motions on short timescales of millions of years, such as the ones shown in the video; to investigate longer timescales, scientists make use of N-body simulations, a numerical procedure that takes into account the gravity actually experienced by the stars at any time in the past or future.

