XMM-Newton and NuSTAR spectrum of the quasar PDS 456

Date: 18 February 2015
Satellite: XMM-Newton and NuSTAR
Copyright: NASA/JPL-Caltech/Keele Univ.
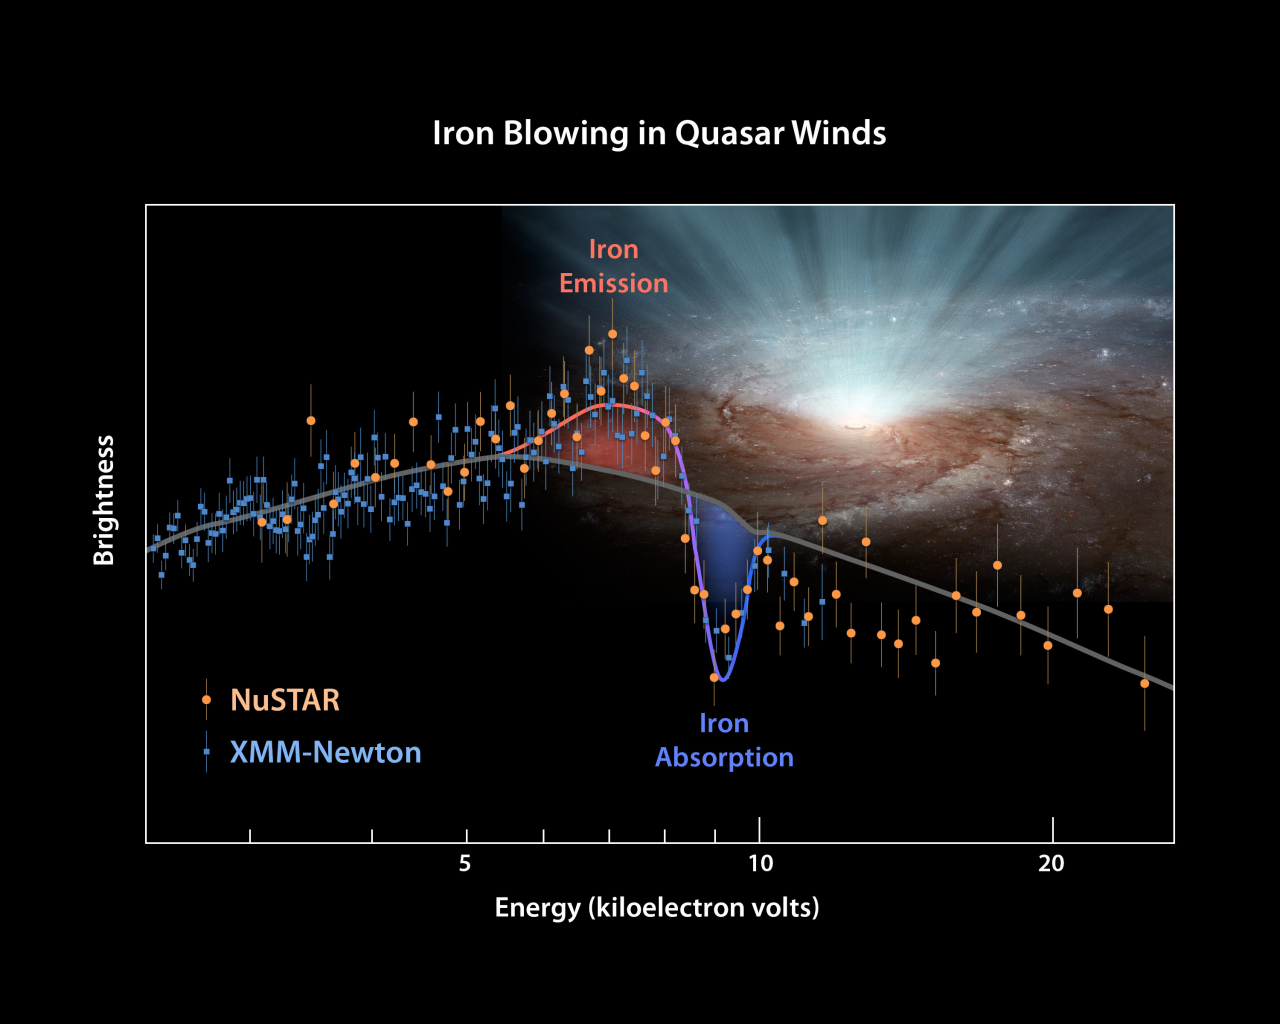
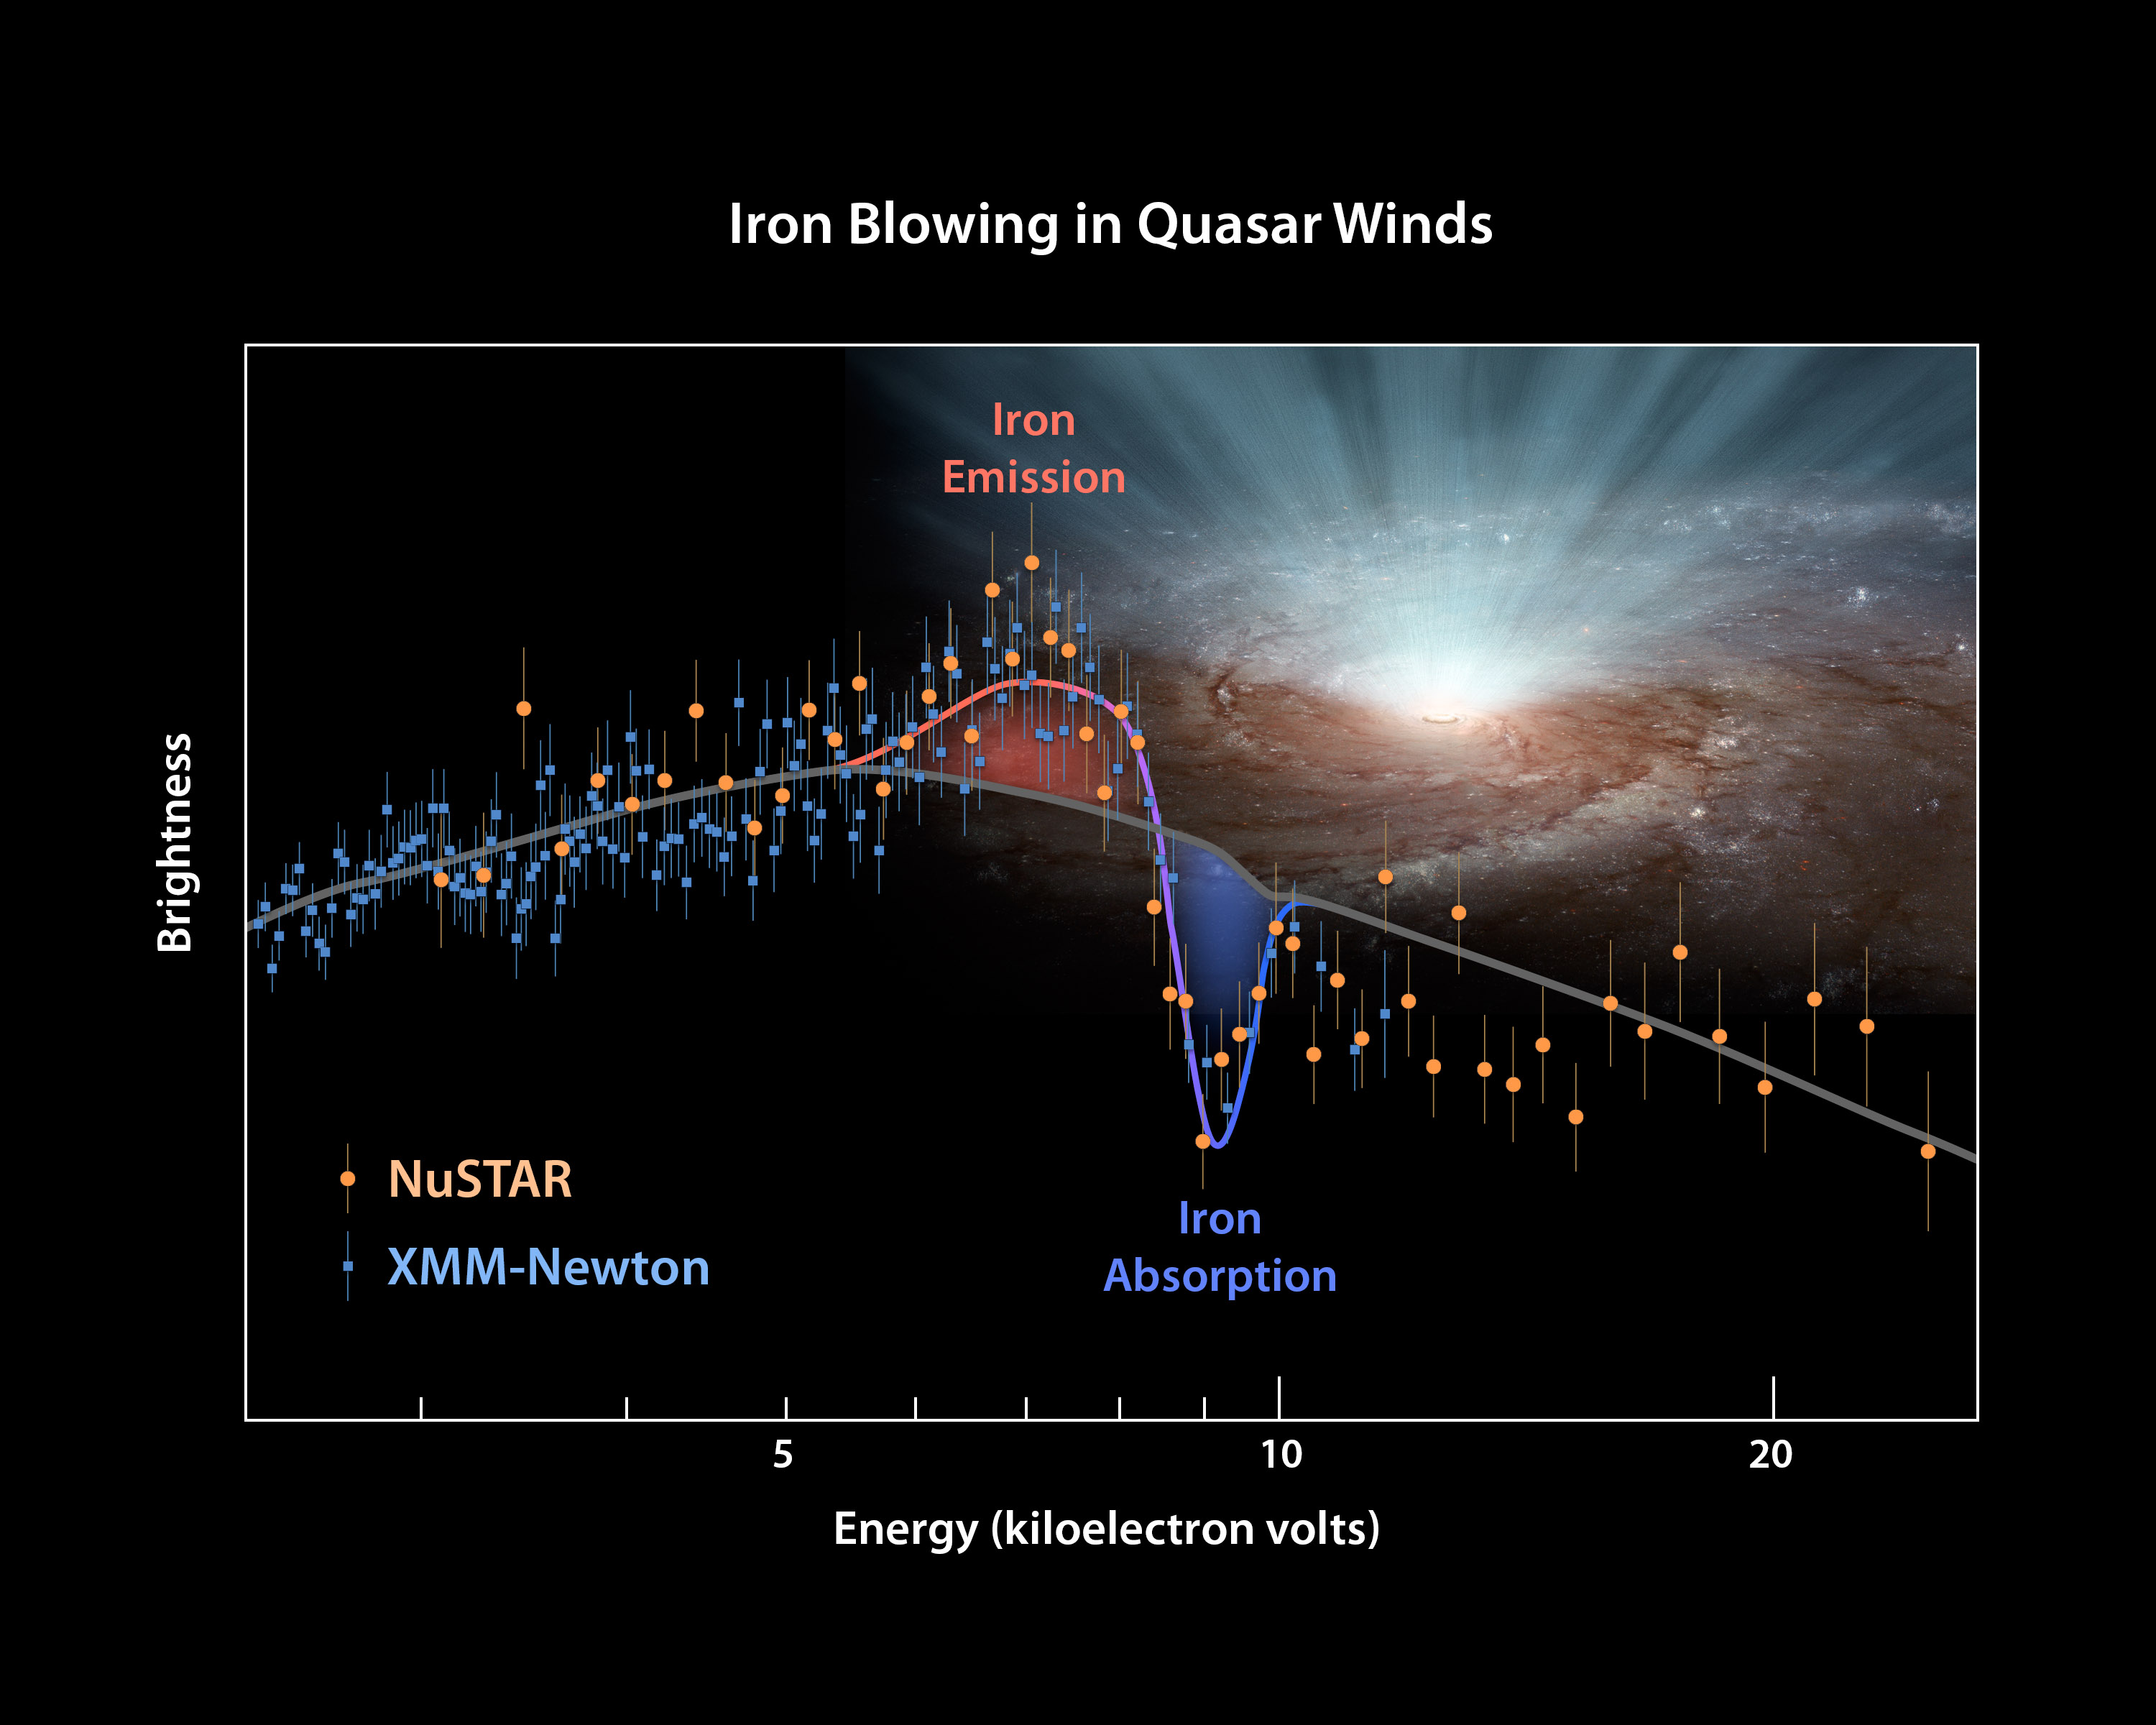
This plot of data from NASA's Nuclear Spectroscopic Telescope Array (NuSTAR) and the European Space Agency's (ESA's) XMM-Newton determines for the first time the shape of ultra-fast winds from supermassive black holes, or quasars. The winds blow in every direction, in a nearly spherical fashion, coming from both sides of a galaxy (only one side is shown in the artist's impression here).
The plot shows the brightness of X-ray light from an extremely luminous quasar called PDS 456, with the highest-energy rays on the right. XMM-Newton sees lower-energy X-rays, and NuSTAR, higher. XMM Newton had previously observed PDS 456 in 2001. At that time, it had measured the X-rays up to an energy level of 11 kiloelectron volts. From those data, researchers detected a dip in the X-ray light, called an absorption feature (see dip in plot). The dip is caused by iron atoms – which are carried by the winds along with other matter – absorbing the X-ray light of a particular energy. What's more, the absorption feature is 'blue-shifted," meaning that the winds are speeding toward us.
These data told researchers that at least some of the winds were blowing toward us – but they didn't reveal whether those winds were confined to a narrow beam along our line of sight, or were blowing in all directions. That's because XMM-Newton had only detected absorption features, which by definition occur in front of a light source, in this case, the quasar. To probe what was happening at the other sides of the quasar, the astronomers needed to find an emission feature, which would indicate that the iron was scattering X-ray light at a particular energy in all directions, not only toward the observer.
NuSTAR and XMM-Newton teamed up to observe PDS 456 simultaneously in 2013 and 2014, and the results of that campaign are shown in this plot. NuSTAR data are represented as orange circles and XMM-Newton as blue squares. The NuSTAR data reveal the baseline of the "continuum" quasar light (see gray line) – or what the quasar would look like without any winds. What stands out is the bump to the left of the dips. That is an iron emission signature, the telltale sign that the black-hole winds blow to the sides and in all directions.