Cosmic expansion measured across the sky

Date: 08 April 2020
Satellite: XMM-Newton
Copyright: K. Migkas et al. 2020, CC BY-SA 3.0 IGO
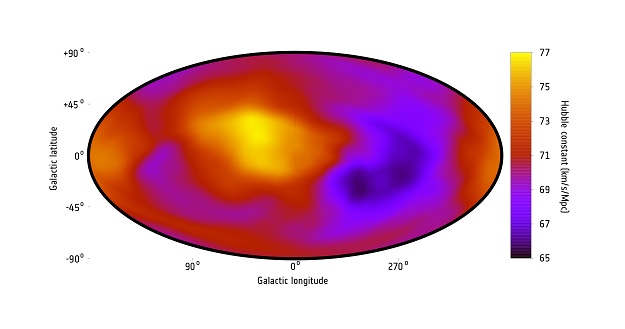
A map of the rate of the Universe's expansion in different directions across the sky, measured by the current study.
The map shows the whole sky in the galactic coordinate system, with the centre of our own galaxy, the Milky Way, located at the centre of the map, and the plane of the galaxy – where most of its stars reside – oriented horizontally across the map (note that Milky Way stars are not shown in the map). The rate of the Universe's expansion, indicated in terms of the so-called Hubble constant, is shown in different colours, with purple hues indicating a slower rate and orange/yellow hues indicating a faster rate.
In a new study based on data from ESA's XMM-Newton, NASA's Chandra and the German-led ROSAT X-ray observatories, astronomers estimated the expansion rate using the X-ray temperature of hundreds of galaxy clusters across the sky and compared the temperature to the clusters' brightnesses. Whereas they expected clusters of the same temperature and located at a similar distance to appear similarly bright, they noticed that clusters tended to be less bright than expected in one direction of the sky than in all others.
The direction in the sky where galaxy clusters appeared less bright is represented by the region shown in purple in this map. If confirmed, the result might challenge the isotropy hypothesis, which assumes that the Universe has the same properties in each direction on large scales. This possibly uneven effect on cosmic expansion might be caused by the mysterious dark energy.
This work is licensed under a Creative Commons Attribution-ShareAlike 3.0 IGO License. 
