Combining remote-sensing and in situ measurements
Date: 16 July 2020
Satellite: Solar Orbiter
Copyright: Solar Orbiter/SPICE Team; SWA Team; EUI Team/ ESA & NASA
ESA's Solar Orbiter carries both remote-sensing instruments to look at the Sun, and in situ instruments that sample the properties of the 'solar wind' around the spacecraft. The solar wind is a magnetically propelled outpouring of particles from the Sun's outer atmosphere, the corona. The particles are electrically charged atoms and electrons that make what physicists call a plasma. By combining data from both the remote-sensing and in situ instruments, we will obtain a more complete picture of how energetic events on the Sun drive changes in the solar wind.
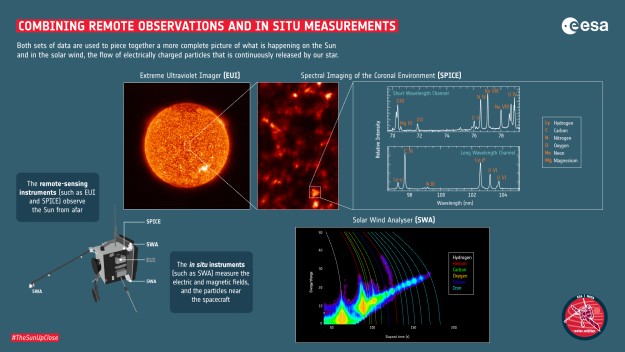
The infographic shows an image of the full solar disc taken by the Extreme Ultraviolet Imager (EUI) instrument in the top left, along with data from the remote-sensing Spectral Investigation of the Coronal Environment (SPICE) instrument and the in situ Solar Wind Analyser (SWA).
The image and graphs to the right oft he EUI image show the first spectrum captured on 21 April 2020 by SPICE. The image shows the distribution of emission from carbon ions in this small region of the Sun's atmosphere at temperatures of around 50 000 K. The graph shows the ultraviolet spectra, revealing a wide range of ionised atoms including hydrogen, carbon, neon, oxygen and iron, which can be identified from their unique 'fingerprint' in the spectrum. These ions are formed at temperatures from 10 000 to one million Kelvin.
The coloured plot below the images shows the first scientific measurements made by the SWA Heavy Ion Sensor (HIS), which samples the solar wind around the spacecraft. The data was taken on 11 May 2020. The sensor is able to determine, among other characteristics, the ratio of a particle's energy to its charge, and its speed across a known distance within the instrument, as given by the time it takes to cross that distance.
This data has then been plotted on the graph along with the theoretical curves of expected ions, which are colour-coded according to the ions in the legend. The coloured patches represent the number of particles (yellow means lots, blue means few) entering the instrument with each characteristic and thus indicate their relative abundance in the solar wind passing the spacecraft.
Through comparison with the SPICE measurements of the coronal composition, this SWA-HIS data will support the establishment of the link between the solar wind passing the spacecraft and its specific source region on the Sun.