The measured clustering of faint, star-forming galaxies

Date: 15 February 2011
Satellite: Herschel
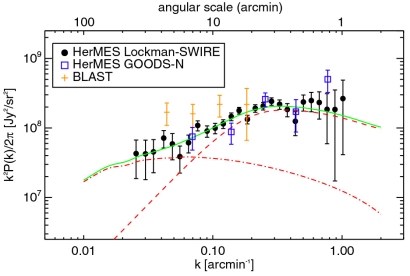
Depicts: Clustering of faint, star-forming galaxies versus angular scale observed on the sky
Copyright: From Amblard, Cooray, Serra et al., Nature, 2011
This graph shows the clustering of faint, star-forming galaxies as a function of the angular scale observed on the sky. Smaller angular scales are plotted towards the right.
The measurements have been achieved by analysing the angular fluctuations in the Cosmic Infrared Background (CIB) as measured by Herschel, at a frequency of 350 micron, in the Lockman Hole field (black dots) and in the GOODS-North field (blue squares), respectively. Previous measurements obtained by the Balloon-borne Large Aperture Submillimeter Telescope (BLAST) are also shown (in orange).
The green line shows the best fit to the Herschel data obtained with the halo model. The red dash-dotted line shows the contribution due to galaxies that reside in different halos (the so-called 2-halo term), whereas the red, dashed-only line shows the contribution of galaxies belonging to the same halo (the so-called 1-halo term), thus probing galaxy clustering on much smaller scales.
As shown in the graph, Herschel has allowed astronomers to measure, for the first time, fluctuations in the CIB down to very small angular scales - about 1 arc minute - making it possible to characterise correlations in the distribution not only of galaxies that reside in different halos, but also of galaxies occupying the same halo.
The measured signal is higher at the small angular scales, meaning that nearby pairs of galaxies tend to cluster more than those that are more far apart.
