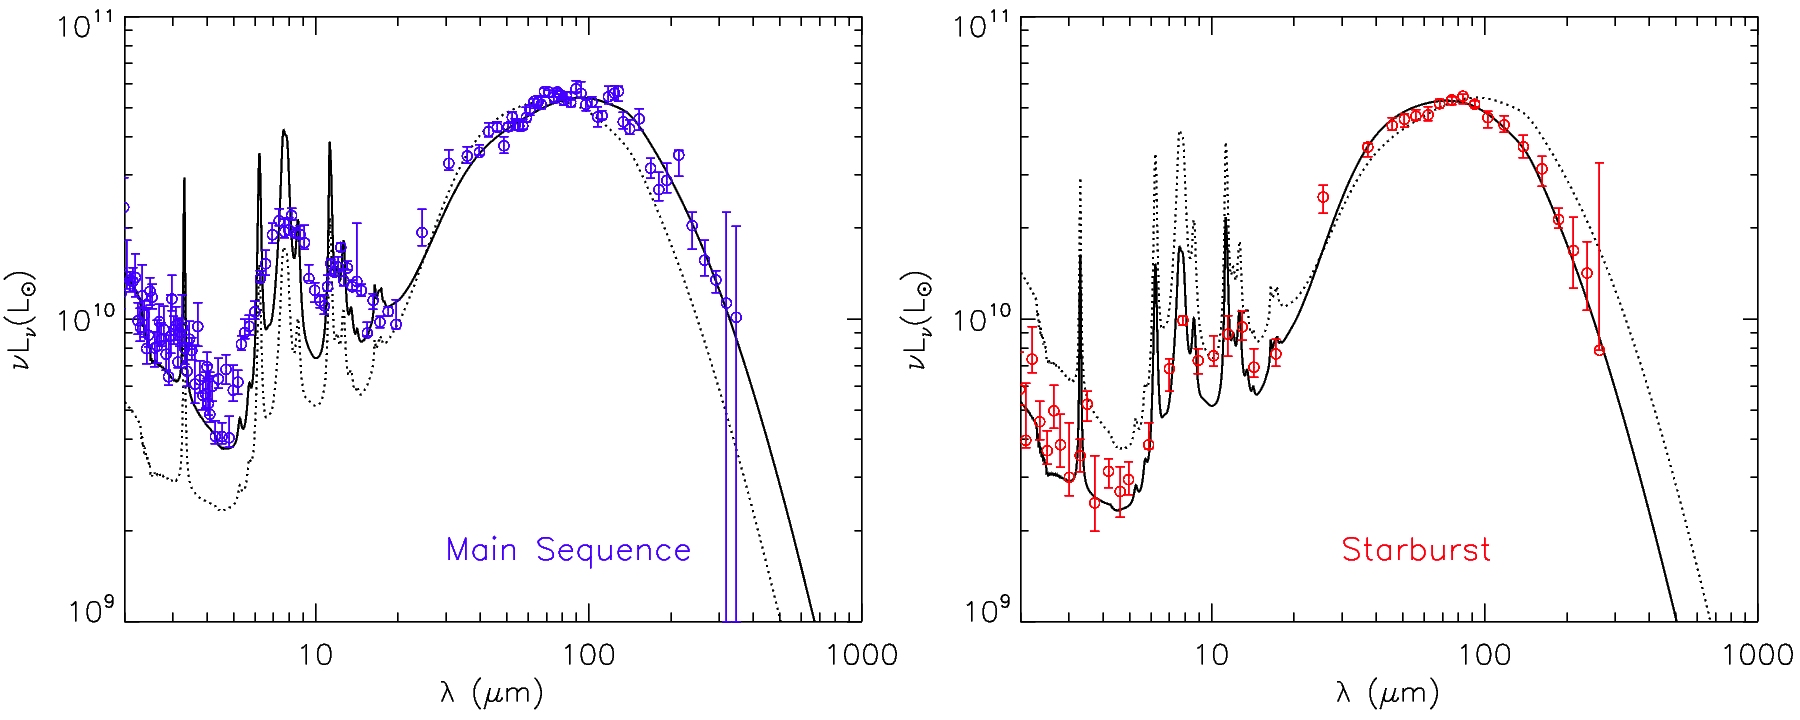
The typical Spectral Energy Distribution of main-sequence and starburst galaxies

Date: 13 September 2011
Satellite: Herschel
Depicts: Typical SED of main-sequence and starburst galaxies
Copyright: Courtesy of David Elbaz, CEA Saclay, Service d'Astrophysique
This graph shows the typical spectral energy distribution of galaxies which are forming stars via gentle, steady processes, also referred to as 'main-sequence' galaxies (left panel), and via violent starbursts triggered by mergers between massive galaxies (right panel).
The main difference is to be found at wavelengths around 8 micron, where the two main modes of star formation leave their distinctive signature.
When triggered by a galactic merger, fierce star formation takes place in very compact regions of a galaxy, and releases an intense flux of ionising ultraviolet radiation. This, in turn, has a destructive effect on polycyclic aromatic hydrocarbon (PAH) molecules, carbon-rich dust grains that populate the interstellar medium. PAHs emit characteristic lines at wavelengths around 8 micron, hence merger triggered starbursts translate into weak emission at 8 micron.
In contrast, when galaxies produce stars via steadier processes, star formation is diluted across the entire galaxy, resulting in less intense ionising flux. Such an environment preserves larger amounts of PAH molecules, giving rise to a stronger 8-micron emission.