The complete lightcurve of CoRot-11

Date: 14 June 2010
Satellite: CoRoT
Copyright: Image courtesy of D. Gandolfi
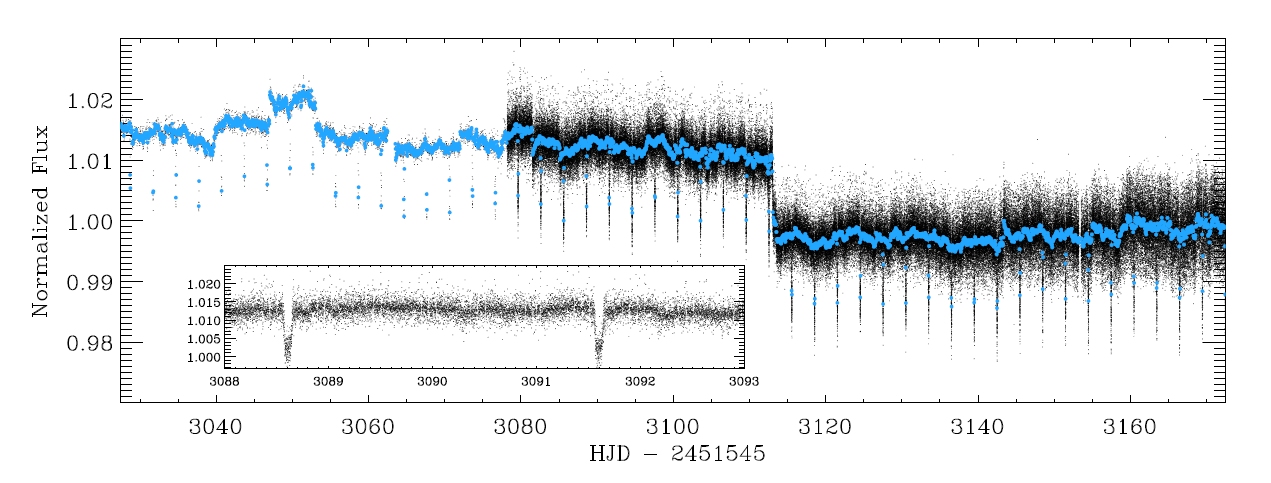
The complete lightcurve of CoRoT-11, based on data collected over 145 days, from 15 April to 7 September, 2008.
The first part of the lightcurve, on the left side of the plot, corresponds to the first approximately 50 days of observations and contains more sparse data, sampled every 512 seconds, whereas the second part, on the right side, consists of data sampled every 32 seconds. The time sampling was switched to a more frequent one after the detection of the transit.
The black dots show the actual data, and the blue dots represent data binned over one hour.
The inset plot shows a magnified view of a section of the light curve, highlighting two transits of CoRoT-11b in front of its parent star.
For further details see: Gandolfi, D., et al., "Transiting exoplanets from the CoRoT space mission XII. CoRoT-11b: a transiting massive 'hot-Jupiter' in a prograde orbit around a rapidly rotating F-type star", submitted to Astronomy and Astrophysics.