Venus Express unveils the cause of Venus' global cloud patterns
3 December 2008
A recent study combining data collected with the VMC and the VIRTIS instruments on board Venus Express has shed light on the atmospheric conditions that give rise to the presence and distribution of the as-yet-unidentified UV absorbers. These absorbers are responsible for the characteristic dark features in the UV images of Venus' cloud deck. Dmitry Titov and colleagues, reporting in the 4 December issue of Nature, have found that it is mainly the temperature and atmospheric dynamics that drive the global pattern of the UV markings. They also determined variations of the cloud top altitude over the Venus globe.
 |
|
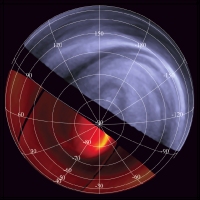
Figure 1. Composite view of Venus' southern hemisphere in infrared (red) and in UV (purple). |
The highly elliptical orbit of Venus Express allows for global imaging of the planet's southern hemisphere. The Venus Monitoring Camera (VMC) captures images in four narrow wavelength bands: two in the infrared, one in the optical and one in the ultraviolet (UV). At the same time the Visible and Infrared Thermal Imaging Spectrometer (VIRTIS) obtains images with a smaller field of view, but simultaneously at many wavelengths in the optical and infrared.
Titov and colleagues use the infrared spectral images of VIRTIS to determine the altitude of the cloud tops and to derive the temperature structure above the clouds. The VMC UV images are used to map the presence of UV absorbers at the cloud tops. By comparing the VIRTIS spectral images with VMC images taken at the same time in the UV they match the atmospheric conditions at the cloud tops to the global pattern of UV markings (Figure 1).
Until now the connection between the UV features and the physical conditions and dynamical processes at the cloud tops have been unclear. Titov and colleagues have found that the distribution of the UV absorbers is closely related to the temperature profile. They discern three global regions on the southern hemisphere from the equator toward the pole:
| |||
| UV dark |
| ||
| |||
| UV bright |
| ||
| |||
| UV dark ring |
| ||
Temperature influence
The study showed that at the lower latitudes (<50°S) the temperature decreases with increasing altitude (referred to as a negative lapse rate). This corresponds to regions where UV absorbers are present. The study team concludes that absorbers are drawn upward from deep in the cloud to the cloud tops by strong convection that is driven by the Sun heating the atmosphere.
In the region between 50°S and 70°S the temperature gradient is inverted and the temperature reaches its minimum at the cloud tops, ~30K cooler than at other latitudes. This annulus of cold air was earlier nicknamed "cold collar". A positive lapse rate here helps to prevent the convective up-welling of UV absorbers from below. This results in the UV bright clouds seen at this latitude range.
Altitude of cloud tops
 |
|
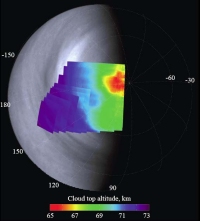
Figure 2. Altitude of cloud tops in Venus' southern hemisphere. |
Since there is a big change in the UV morphology at around the latitude 50°S, the authors of this study conclude that it is not the cloud altitude that drives the UV morphology. They propose that the brightness variation in the cloud tops is caused by the temperature profile variation and the consequent difference in the amount of UV absorber that is brought up from deep in the cloud.
A global picture
Based on the VIRTIS and VMC data, Titov and colleagues arrive at a global picture of the processes that determine the amount of UV absorbers at the cloud tops. They conclude that it is not the altitude that determines the UV-dark features, but instead the temperature plays a key role. In addition they also find that the dynamics in the lower atmosphere is related to the distribution of UV absorbers. This is indicated by the fact that the transition in UV brightness of the Venus disc at the 50°S latitude coincides with a change in zonal winds that is known from other studies (see also "A 3D view of variable winds in Venus's cloud layers" in the right-hand menu). Other indications of the link between atmospheric dynamics and UV absorbers come from the polar region. UV-dark features there are related to the south polar vortex that is observed at other wavelengths. A UV-dark polar ring at latitude ~70°S encircles the vortex eye and its spiral arms are often connected to this ring.
The findings in the cloud top morphology based on the Venus Express data correlate well with earlier missions that studied the northern hemisphere, which suggest that the three identified latitude zones in the UV absorber patterns are globally symmetric about the equator.
Related publication
Titov, D.V. et al, "Atmospheric structure and dynamics as the cause of ultraviolet markings in the clouds of Venus", to appear in Nature, vol. 456, 4 December 2008
