Super-hurricane-force winds on Venus are getting stronger
18 June 2013
As the closest planet to Earth, Venus is a relatively easy object to observe. However, many mysteries remain, not least the super-rotation of Venus' atmosphere, which enables high altitude winds to circle the planet in only four days. Now images of cloud features sent back by ESA's Venus Express orbiter have revealed that these remarkably rapid winds are becoming even faster. |
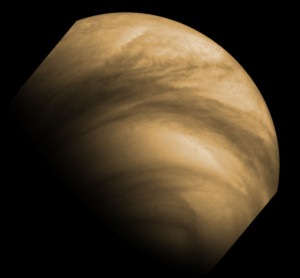
| Venus cloud tops. Credit: ESA/MPS/DLR/IDA |
Similar in size to Earth, Venus has an extremely dense, carbon-dioxide-rich atmosphere and the planet's surface is completely hidden by a blanket of bland, yellowish cloud. Only at ultraviolet wavelengths (and to a lesser extent in the infrared) do striking cloud streaks and individual cells emerge, due to the presence of some unknown UV absorber in the cloud deck.
By tracking the movements of these distinct cloud features, observers have been able to measure the super-hurricane-force winds that sweep around the planet at the cloud tops, some 70 km above the scorching volcanic plains.
Despite decades of observation from the ground and from spacecraft, a number of mysteries remain. What causes the remarkable super-rotation of Venus' atmosphere – so called because the upper winds travel 50 times faster than the planet's rate of rotation? How do the winds vary with latitude and longitude? How much do they change over time?
The answers to some of these questions are being provided by instruments on board Venus Express, such as the Venus Monitoring Camera (VMC), which have been observing the atmosphere for 10 Venus years – equivalent to 6 Earth years.
The VMC acquires instantaneous snapshots of Venus at UV and near-infrared wavelengths. Simultaneous imaging in these wavebands makes it possible to detect and track cloud features, and thus derive wind data, at two different levels - approximately 70 km and 60 km above the surface.
| A day in the life of Venus Express. Credit: ESA/MPS/DLR/IDA, M. Pérez-Ayúcar & C. Wilson (Click here for further details and larger versions of this video.) |
Venus Express follows a 24 hour orbit which approaches to approximately 250 km above the north pole, before moving out to a distance of
These factors combined mean that VMC imagery provides, for the first time, an opportunity to study cloud level winds with high spatial and temporal resolution over a time scale of more than half a decade.
The latest analyses of Venus' cloud motions and wind speeds, based on VMC data, have been made by two independent teams - one led by a Russian group (Khatuntsev et al.) and the other by a Japanese group (Kouyama et al.). By painstakingly measuring how cloud features in VMC images move between frames, the two groups have been able to reveal new patterns in the planet's circulation.
"We analysed images obtained during 127 orbits with a manual cloud tracking method, and 600 orbits with a digital correlation method," said Igor Khatuntsev from the Space Research Institute in Moscow, lead author of a paper in the journal Icarus. "Over 45 000 features were tracked by human visual comparisons, and more than 350 000 features were tracked automatically using a computer programme."
 |
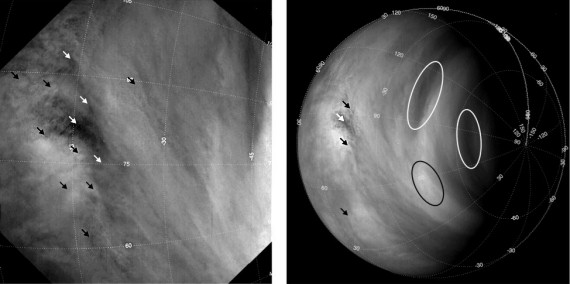
| Tracking clouds on Venus. Credit: Fig. 3 from Khatuntsev et al., Cloud level winds from the Venus Express Monitoring Camera imaging, Icarus (2013); doi: 10.1016/j.icarus.2013.05.018 |
The manual method of wind speed measurements consisted of tracking motions of high contrast cloud features in pairs of images taken at different times. This allowed better recognition of cloud patterns and was more reliable than the digital method in middle to high latitudes, where clouds tend to be streaky, or where contrast was low. The problem with this method is that it is very time consuming.
On the other hand, the digital tracking technique was capable of streamlining image processing and producing 10 times the number of wind vectors. Both methods were in good agreement at low latitudes (below 40 degrees), but digital tracking was preferred for studying temporal variations of the mean (average) rate of flow.
The Japanese-Swedish team relied solely upon their own automated cloud tracking method to derive their motion from images taken about one hour apart, at latitudes between 55°S and 70°S. A specially developed mathematical formula was used to reduce errors in the image analysis. This team's analysis is published in the Journal of Geophysical Research.
Variable winds
The detailed analysis made it possible to establish the mean atmospheric circulation, its long-term and diurnal trends, orbit-to-orbit variations and periodicities.
In low latitudes the mean zonal (east-west) wind is about 94 m/s (338 km/h) in a retrograde direction. (Both Venus' surface and atmosphere rotate in retrograde direction, i.e. clockwise seen from the north pole, the opposite direction to the rotation of the other planets.)
The zonal wind speed usually peaks at 40 - 50°S, reaching approximately 102 m/s (367 km/h) in a mid-latitude jet stream. Poleward from 50°S, zonal wind speed rapidly decreases. This means that the cloud top winds take up to five days to circle the planet's equator, but only about three days in the mid-latitudes.
The mean meridional (equator to pole) wind slowly increases from zero at the equator to about 10 m/s (36 km/h) at 50°S. At higher latitudes, the meridional wind slows steadily, reaching zero close to the fast-moving eye of the global vortex located at the pole.
The VMC-derived wind profiles showed significant variability from orbit to orbit. In low latitudes, variations in the mean zonal speed sometimes exceeded 25 m/s (90 km/h). This corresponded to a dramatic variation from 3.9 days to 5.3 days in the period of atmospheric rotation. The latitude of the high speed jet also varied considerably, ranging from 38°S to 57°S.
| Increasing wind speeds on Venus. Credit: Data: Khatuntsev et al.; background image: ESA |
Perhaps the most dramatic discovery was a steady increase in the mean cloud top wind speeds at low latitude from around 300 km/h to almost 400 km/h (80 - 110 m/s) in the period 2006 - 2013.
"This is an enormous increase in the already high rotation rate of the atmosphere," said Igor Khatuntsev. "Such a large variation has never before been observed on Venus, and we do not yet understand why this occurred."
Both papers also show that the wind speeds demonstrate both short term and long term oscillations. These include regular variations linked to the local time of day and the altitude of the Sun above the horizon.
Other changes in wind speed were harder to explain. In some observations, the zonal wind gradually decreased from 100 - 110 m/s at the equator to less than 50 m/s in the polar regions, while in others the wind velocity was almost constant up to 40°S, with a prominent jet at 50°S. The velocity difference between consecutive orbits in the jet region could be as great as 30 m/s (over 100 km/h).
Between the equator and 35°S latitude, the zonal wind velocity was found to oscillate roughly every 4.8 days, similar to the super-rotation period at the equator. This periodicity seems to be linked to waves in the upper troposphere.
There is also some evidence of a much slower periodic oscillation which occurs roughly every Venusian year.
"We found a peak every 238 days, but this may not be real," said Igor Khatuntsev. "It may be associated with the periods when the VMC was able to conduct observations of the planet's day side."
"Our analysis of the cloud-tracked dayside velocities derived from Venus Express VMC images showed that the mean zonal velocity varied repeatedly by more than 20 m/s over a period of about 255 days," said Toru Kouyama from the Information Technology Research Institute, National Institute of Advanced Industrial Science and Technology, in Ibaraki, Japan.
"These papers increase the number of questions that we need to answer about the atmospheric super-rotation of Venus, which is one of the great unexplained mysteries of the Solar System," said Håkan Svedhem, ESA's Venus Express Project Scientist.
"Further investigations into the spatial structure of these wind oscillations are needed in order to explain what drives the atmospheric circulation patterns. Meanwhile, Venus Express continues to surprise us with its ongoing observations of this dynamic, changing planet."
Related publications
I. Khatuntsev et al., Cloud level winds from the Venus Express Monitoring Camera imaging, accepted for publication in the Journal Icarus; doi:10.1016/j.icarus.2013.05.018
T. Kouyama et al., Long-term variation in the cloud-tracked zonal velocities at the cloud top of Venus deduced from Venus Express VMC images. In press at Journal of Geophysical Research - Planets; doi:10.1029/2011JE004013.
Notes to Editors
Europe's first mission to Venus, Venus Express was launched from Baikonur Cosmodrome on 9 November 2005 on a Soyuz-Fregat launcher. It was inserted into Venus orbit on 11 April 2006. Venus Express orbits the planet in a 24 h period polar orbit. Its payload includes a combination of spectrometers, spectro-imagers, and imagers covering a wavelength range from ultraviolet to thermal infrared, a plasma analyser and a magnetometer.
The observations described in this article were carried out using the Venus Monitoring Camera (VMC; principal investigator W. Markiewicz, MPI-Ae, Katlenburg-Lindau, Germany). The VMC is a wide-angle multi-channel camera that takes images in the near infrared, ultraviolet and visible wavelengths.
Contacts
Igor Khatuntsev
Senior Researcher
Space Research Institute of the Russian Academy of Sciences (IKI RAN)
Moscow, Russia
Email: khatuntsev![]() iki.rssi.ru
iki.rssi.ru
Toru Kouyama
Information Technology Research Institute
National Institute of Advanced Industrial Science and Technology
Ibaraki, Japan
Email: t.kouyama![]() aist.go.jp
aist.go.jp
Håkan Svedhem
ESA Venus Express Project Scientist
Directorate of Science and Robotic Exploration
European Space Agency
Email: h.svedhem![]() esa.int
esa.int
Phone: +31-71-565-3370


