Gaia's new map of star density
Date: 25 April 2018
Satellite: Gaia
Copyright: ESA/Gaia/DPAC, CC BY-SA 3.0 IGO
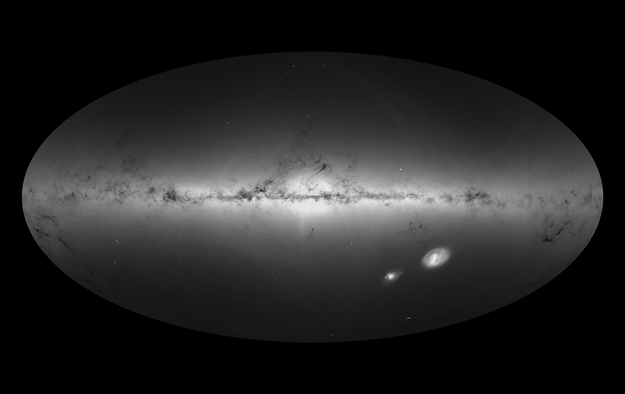
An all-sky view of our Milky Way Galaxy and neighbouring galaxies, based on measurements of nearly 1.7 billion stars. The map shows the density of stars observed by Gaia in each portion of the sky between July 2014 to May 2016.
Brighter regions indicate denser concentrations of stars, while darker regions correspond to patches of the sky where fewer stars are observed. In contrast to the brightness map in colour, which is dominated by the brightest and most massive stars, this view shows the distribution of all stars, including faint and distant ones.
The bright horizontal structure that dominates the image is the Galactic plane, the flattened disc that hosts most of the stars in our home Galaxy, with the Galactic centre in the middle.
The elongated feature visible below the Galactic centre and pointing in the downwards direction is the Sagittarius dwarf galaxy, a small satellite of the Milky Way that is leaving a stream of stars behind as an effect of our Galaxy's gravitational tug. This faint feature is only visible in this view, and not in the all-sky map based on the luminosity of stars, which is dominated by bright sources.
Darker regions across the Galactic plane correspond to foreground clouds of interstellar gas and dust, which absorb the light of stars located further away, behind the clouds. Many of these conceal stellar nurseries where new generations of stars are being born.
Sprinkled across the image are also many globular and open clusters – groupings of stars held together by their mutual gravity, as well as entire galaxies beyond our own.
The two bright objects in the lower right of the image are the Large and Small Magellanic Clouds, two dwarf galaxies orbiting the Milky Way. Other nearby galaxies are also visible, most notably the Milky Way's largest galactic neighbour the Andromeda galaxy (also known as M31), seen in the lower left of the image along with its satellite, the Triangulum galaxy (M33).
A number of artefacts are also visible on the image in the form of curved features and darker stripes, though in much lesser extent with respect to Gaia's first map of the sky, which was based on only 14 months of the satellite's data. These features are not of astronomical origin but rather reflect Gaia's scanning procedure, and will gradually fade away as more data are gathered during the five-year mission.
The second Gaia data release was made public on 25 April 2018 and includes the position and brightness of almost 1.7 billion stars, and the parallax, proper motion and colour of more than 1.3 billion stars. It also includes the radial velocity of more than seven million stars, the surface temperature of more than 100 million and other astrophysical parameters of 70–80 million stars. There are also more than 500 000 variable sources, and the position of 14 099 known Solar System objects – most of them asteroids – included in the release.
Acknowledgement: Gaia Data Processing and Analysis Consortium (DPAC); A. Moitinho / A. F. Silva / M. Barros / C. Barata, University of Lisbon, Portugal; H. Savietto, Fork Research, Portugal.
This work is licensed under a Creative Commons Attribution-ShareAlike 3.0 IGO License. 


