Cluster takes a new look at the plasmasphere
13 November 2006
Using dedicated multipoint analysis tools developed for the ESA/NASA Cluster mission, scientists have unraveled properties of density structures in three dimensions on large, medium and small scales in the outer regions of the plasmasphere. Together with remote sensing data collected by the NASA IMAGE mission, these results show that this is a surprisingly dynamic place! This article emphasizes recent scientific highlights on this region obtained during a PhD thesis performed in Belgium and defended in France (June 2006), awarded with high honours. Since the launches of the Cluster spacecraft, more than 25 PhDs based on Cluster data have been defended successfully so far.
 |
|
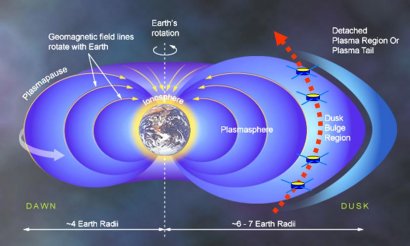
Image 1. At every orbit, the four Cluster spacecraft (C1, C2, C3, C4) have their perigee at around 4 Earth radii (1 Earth radius or RE: 6371 km). Thus, the spacecraft fly systematically through the outer regions of the plasmasphere from south to north (see red dotted arrow), unless geomagnetic activity is so strong that the plasmasphere shrinks before being refilled and expanding back to its natural location. |
The plasmasphere is a doughnut shaped plasma cloud surrounding the Earth, which encompasses the ionosphere (Image 1). It is filled with cold and dense plasma of ionospheric origin which mainly corotates with the Earth. Over the past 6 years, the ESA/NASA Cluster mission and the NASA IMAGE spacecraft have allowed a new look at this region. While IMAGE used remote sensing techniques to provide global images of the plasmasphere, Cluster provides multipoint in-situ measurements.
These measurements are however tricky to perform and analyse. Local magnetic signatures are indeed difficult to extract from the intense geomagnetic field while measurements of the cold plasma (a few eV) suffer from the adverse effects of spacecraft charging. The studies reported here rely on Cluster measurements of the magnetic field by the highly accurate FluxGate Magnetometer (FGM) and of the electron density, obtained from the plasma frequency identified by the wave experiment named WHISPER. Two multipoint analysis tools have been used:
- the spatial gradient method which makes use of simultaneous measurements at four points
- the time-delay method, which is based on the relative timing at which each spacecraft encounters the same structures
Large-scale structure
A study published on 26 April 2006, in Geophysical Research Letters presents the first systematic spatial gradient results in the plasmasphere using Cluster. "Gradient computation is difficult. We are lucky to have data from FGM and WHISPER, which are both well-calibrated. Even small systematic errors, for example due to calibration problems, would make the computation of a reliable gradient impossible. The spatial gradient also works only for rather small spacecraft separations, a few hundreds of kilometres", says lead author Dr. Darrouzet of the Belgian Institute for Space Aeronomy (BIRA-IASB), Brussels, Belgium. Comparing the orientation of the gradients of magnetic field strength and of plasma density with the local magnetic field orientation (Image 2) allows for the evaluation of the relative importance between two effects: the increase of the density and the magnetic field strength along the field lines away from the equator, and the decrease of these two quantities away from the Earth. The increase of the magnetic field strength along the field lines away from the equator is compatible with a tilted dipole, but there appears to be a deviation from cylindrical symmetry.
 |
|
Image 2. Angles between the local magnetic field and the gradient of field strength (blue curve) and density (red curve) during a plasmasphere pass by Cluster on 7 August 2003. The place where the blue curve is at 90° corresponds to the magnetic equator. The density gradient is close to perpendicular to the magnetic field throughout much of the pass. (From Darrouzet, F. et al [2006a]) |
"Remarkably, we found that there is almost no field-aligned density gradient at the magnetic latitudes sampled by Cluster (equatorial latitudes, between -30° and +30°), which suggests that the refilling of flux tubes is a gradual process. We did find, however, pronounced transverse density structure!", underlines Dr. De Keyser co-author of this study, also from BIRA-IASB.
Medium-scale structures: Plasmaspheric plumes
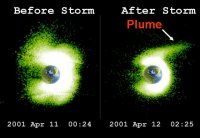
In another recent study, published in Annales Geophysicae in July 2006, Dr. Darrouzet and colleagues present an in-situ analysis of plasmaspheric medium scale density structures called plumes. A plasmaspheric plume is a prominent signature of the erosion of the plasmasphere during a space storm. When a space storm hits the plasmasphere, it shrinks it and strips away its outer layer forming a huge plume of eroded plasma, while the plasmasphere and the plume continue the daily rotation around the Earth (Image 3).
|
Image 3. "Before" and "after" illustrations of plasmaspheric erosion caused by the 11 April space storm as measured by the EUV imager onboard the NASA IMAGE mission. |
 |
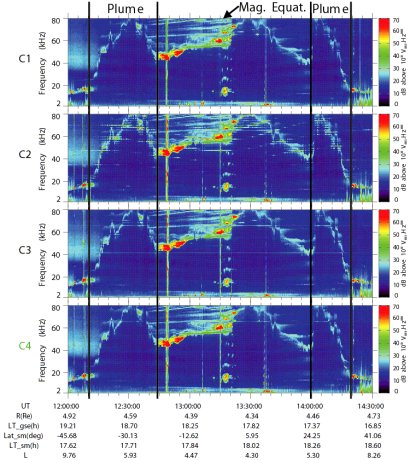
Depending on the situation, the spatial gradient or the time-delay methods are used to derive the normal direction of plume boundaries as well as the normal boundary velocity. This boundary velocity can be compared with the drift velocity measured by the Electron Drift Instrument (EDI) onboard Cluster, sometimes with the ion spectrometer (CIS) velocity, and with the velocities inferred from successive global images of the plasmasphere from IMAGE. Shown on Image 4 are frequency-time spectrograms from the four WHISPER instruments during a plasmasphere pass in the dusk sector on 2 June 2002, indicating traversal of a very wide plume in the inbound (IP) and outbound passes (OP) on all four spacecraft.
 |
|
Image 4. Frequency-time electric field spectrograms measured by the four Cluster/WHISPER instruments on 2 June 2002, showing the entire plasmasphere crossing, including plume traversals in the inbound and outbound passes and the magnetic equator crossed at 13:15 UT. The orbital parameters correspond to C4. (From Darrouzet, F. et al [2006b]) |
The electron density profiles as determined from WHISPER are essentially the same for the in- and outbound traversals (Image 5). The same plume is crossed in the southern and northern hemispheres, suggesting that the plume has not moved much over the 2 hours between the inbound and the outbound traversal. This is confirmed by the equatorial normal boundary velocities VN-eq derived from the time profiles and shown on the image.
 |
|
Image 5. Electron density derived from Cluster/WHISPER spectrograms as a function of Requat (geocentric distance of the field line on which the observation is made, measured at the magnetic equator) for the plume crossings on 2 June 2002. The lower four curves correspond to the inbound pass and the upper four curves (shifted by a factor 10) to the outbound pass. The magnitude of the normal boundary velocity VN-eq derived from the time delays of different features and projected onto the magnetic equatorial plane is indicated. (From Darrouzet, F. et al [2006b]) |
"Our results indicate that the inner shells of the plasmasphere are generally corotating with the Earth, with departures from corotation more outward. The plumes that we have observed sometimes extend across more than four hours of local time; their transverse size ranges from 0.5 to 1.5 RE, and they are seen at radial distances from 5.5 to 8.5 RE. The plumes are rotating around the Earth, with their fully corotating foot attached to the main plasmasphere, but with their tip often rotating more slowly and moving outward, away from the Earth" says Dr. Darrouzet. "The comparison with global images gives consistent results."
Small-scale structures
Earlier work by Dr. Darrouzet and co-authors, published in Annales Geophysicae in July 2004, addressed small-scale density irregularities observed by Cluster in the main body of the plasmasphere. Such irregularities appear to have a transverse equatorial size that is exponentially distributed, with a characteristic value of ~300 km, going up to 5000 km, and with a characteristic density variation of 20%. Multi-point analysis techniques can only be applied to the largest of these and demonstrate that these irregularities are essentially field-aligned. They tend to be more common for higher geomagnetic activity.
Outlook
This work formed the basis of Dr. Darrouzet's PhD thesis, which he prepared under the supervision of Dr. Pierrette Décréau (LPCE, Orléans) and Dr. Johan De Keyser (BIRA-IASB, Brussels), and defended at the Université d'Orléans in France in June 2006. "All these Cluster results show that the plasmasphere is a much more complex and dynamic region than anticipated. That's why my colleagues and I at the Belgian Institute for Space Aeronomy want to continue to work on this subject. And as the Cluster configuration changes with time, the spacecraft offer new perspectives!" says Dr. Darrouzet.
"We still have not exploited the full potential of the Cluster mission. As we are still improving our multi-point analysis tools, we find that Cluster proves that 1+1+1+1 > 4: flying four spacecraft in formation is really more than having four individual missions!", adds Dr. De Keyser.
Editor's note
The plasma distribution inside the plasmasphere and the occurrence of plumes depend on the solar wind conditions. The behaviour of the plasmasphere, in turn, has implications for the Earth's ionosphere and can affect radio transmissions and GPS signals. Such effects are part of "Space Weather" - a field to which Europe is committed. Indeed, today marks the beginning of the Third European Space Weather Week (ESWW3), held in Brussels, Belgium. See also the link to the event on the right-hand side.
The website for ESWW3 is: http://sidc.oma.be/esww3/
References
Darrouzet, F., De Keyser, J., Décréau, P. M. E., Lemaire, J. F., and Dunlop, M. W., Spatial gradients in the plasmasphere from Cluster, Geophys. Res. Lett., 33, L08105, doi:10.1029/2006GL025727, 2006
Darrouzet, F., De Keyser, J., Décréau, P. M. E., Gallagher, D. L., Pierrard, V., Lemaire, J. F., Sandel, B. R., Dandouras, I., Matsui, H., Dunlop, M., Cabrera, J., Masson, A., Canu, P., Trotignon, J. G., Rauch, J. L., and André, M., Analysis of plasmaspheric plumes: CLUSTER and IMAGE observations, Ann. Geophys., 24, 1737-1758, 2006
Darrouzet, F., Décréau, P. M. E., De Keyser, J., Masson, A., Gallagher, D. L., Santolik, O., Sandel, B. R., Trotignon, J. G., Rauch, J. L., Le Guirriec, E., Canu, P., Sedgemore, F., André, M., and Lemaire, J. F., Density structures inside the plasmasphere: Cluster observations, Ann. Geophys., 22, 2577-2585, 2004
Related web stories
September 2004 story: Cluster locates the source of non-thermal terrestrial continuum radiation by triangulation
October 2001 story: Cluster Measurements of Density Gradients
June 2001 story: Cluster's whispers probe the electrifying plasmasphere
Contact
Main authors
Fabien Darrouzet and Johan De Keyser
Belgian Institute for Space Aeronomy, Brussels, Belgium
e-mail: Fabien.Darrouzet bira-iasb.oma.be, Johan.DeKeyserbira-iasb.oma.be
phone: +32-2-37-30-381
Web story editors
Philippe Escoubet, Arnaud Masson and Matthew Taylor
SCI-SM/SCI-SO division, RSSD, ESA, The Netherlands
e-mail: Philippe.Escoubetesa.int / Arnaud.Massonesa.int / mtaylorrssd.esa.int
phone: +31-71-565-4564/+31-71-565-5634/+31-71-565-8009 (Taylor)
