Overview of the event
 Date: 24 March 2009
Satellite: Cluster
Copyright: ESA
Show in archive: true
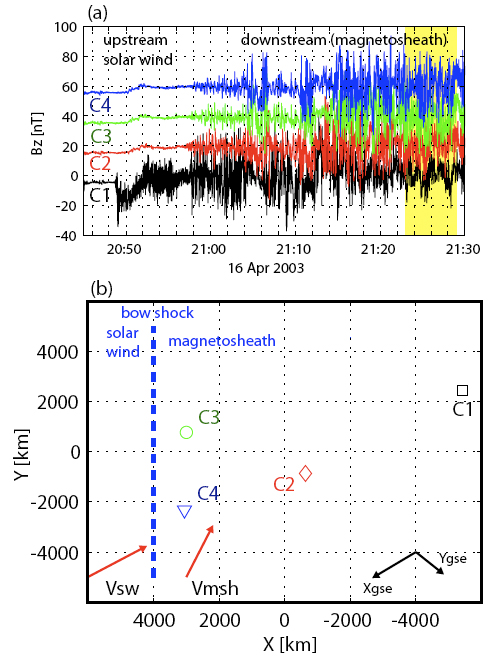
Magnetic field data collected on 16 April 2003 by the four Cluster satellites (C1, C2, C3 and C4) are plotted. A 4 minute interval, marked in yellow, was studied by Yordanova et al. One property of the turbulence, the intermittency, was studied in particular and was accurately reproduced with a theoretical model.
Overview of the event: (a) BZ component; the different spacecraft observations are offset by 20 nT for clarity. The 4 min interval that is analyzed in detail is marked in yellow. (b) The Cluster spacecraft configuration during this period. At this time the Cluster satellites were widely spread in space, from just behind the bow shock (C3 and C4) to more than 8000 kilometers away (C1), while C2 was located in between.
Date: 24 March 2009
Satellite: Cluster
Copyright: ESA
Show in archive: true
Magnetic field data collected on 16 April 2003 by the four Cluster satellites (C1, C2, C3 and C4) are plotted. A 4 minute interval, marked in yellow, was studied by Yordanova et al. One property of the turbulence, the intermittency, was studied in particular and was accurately reproduced with a theoretical model.
Overview of the event: (a) BZ component; the different spacecraft observations are offset by 20 nT for clarity. The 4 min interval that is analyzed in detail is marked in yellow. (b) The Cluster spacecraft configuration during this period. At this time the Cluster satellites were widely spread in space, from just behind the bow shock (C3 and C4) to more than 8000 kilometers away (C1), while C2 was located in between.
Last Update: 1 September 2019