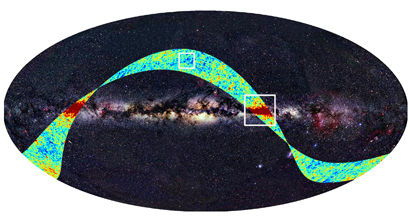
Planck First Light Survey

Date: 17 September 2009
Satellite: Planck
Depicts: First light survey superposed on an all-sky map
Copyright: ESA, LFI & HFI Consortia (Planck), Background image: Axel Mellinger
A map of the whole sky at optical wavelengths shows a prominent horizontal band which is the light shining from our own Milky Way, seen in profile from our vantage point.
The superposed false-colour strip shows the area of the sky mapped by Planck during the First Light Survey. The colours indicate the magnitude of the deviations of the temperature of the Cosmic Microwave Background from its average value, as measured by Planck at a frequency close to the peak of the CMB spectrum (red is hotter and blue is colder). The large red strips trace radio emission from the Milky Way, whereas the small bright spots high above the galactic plane correspond to emission from the Cosmic Microwave Background itself.
The two squares indicate the location of the detailed images shown in the other figures from the Planck First Light Survey released on 17 September 2009 (see "Planck first light yields promising results" in right-hand menu).

