The flux decline of the Crab Nebula

Date: 11 January 2011
Satellite: Fermi, Swift, Rossi, INTEGRAL
Depicts: Flux Emission from Crab Nebula
Copyright: From Wilson-Hodge et al., ApJL, 20XX
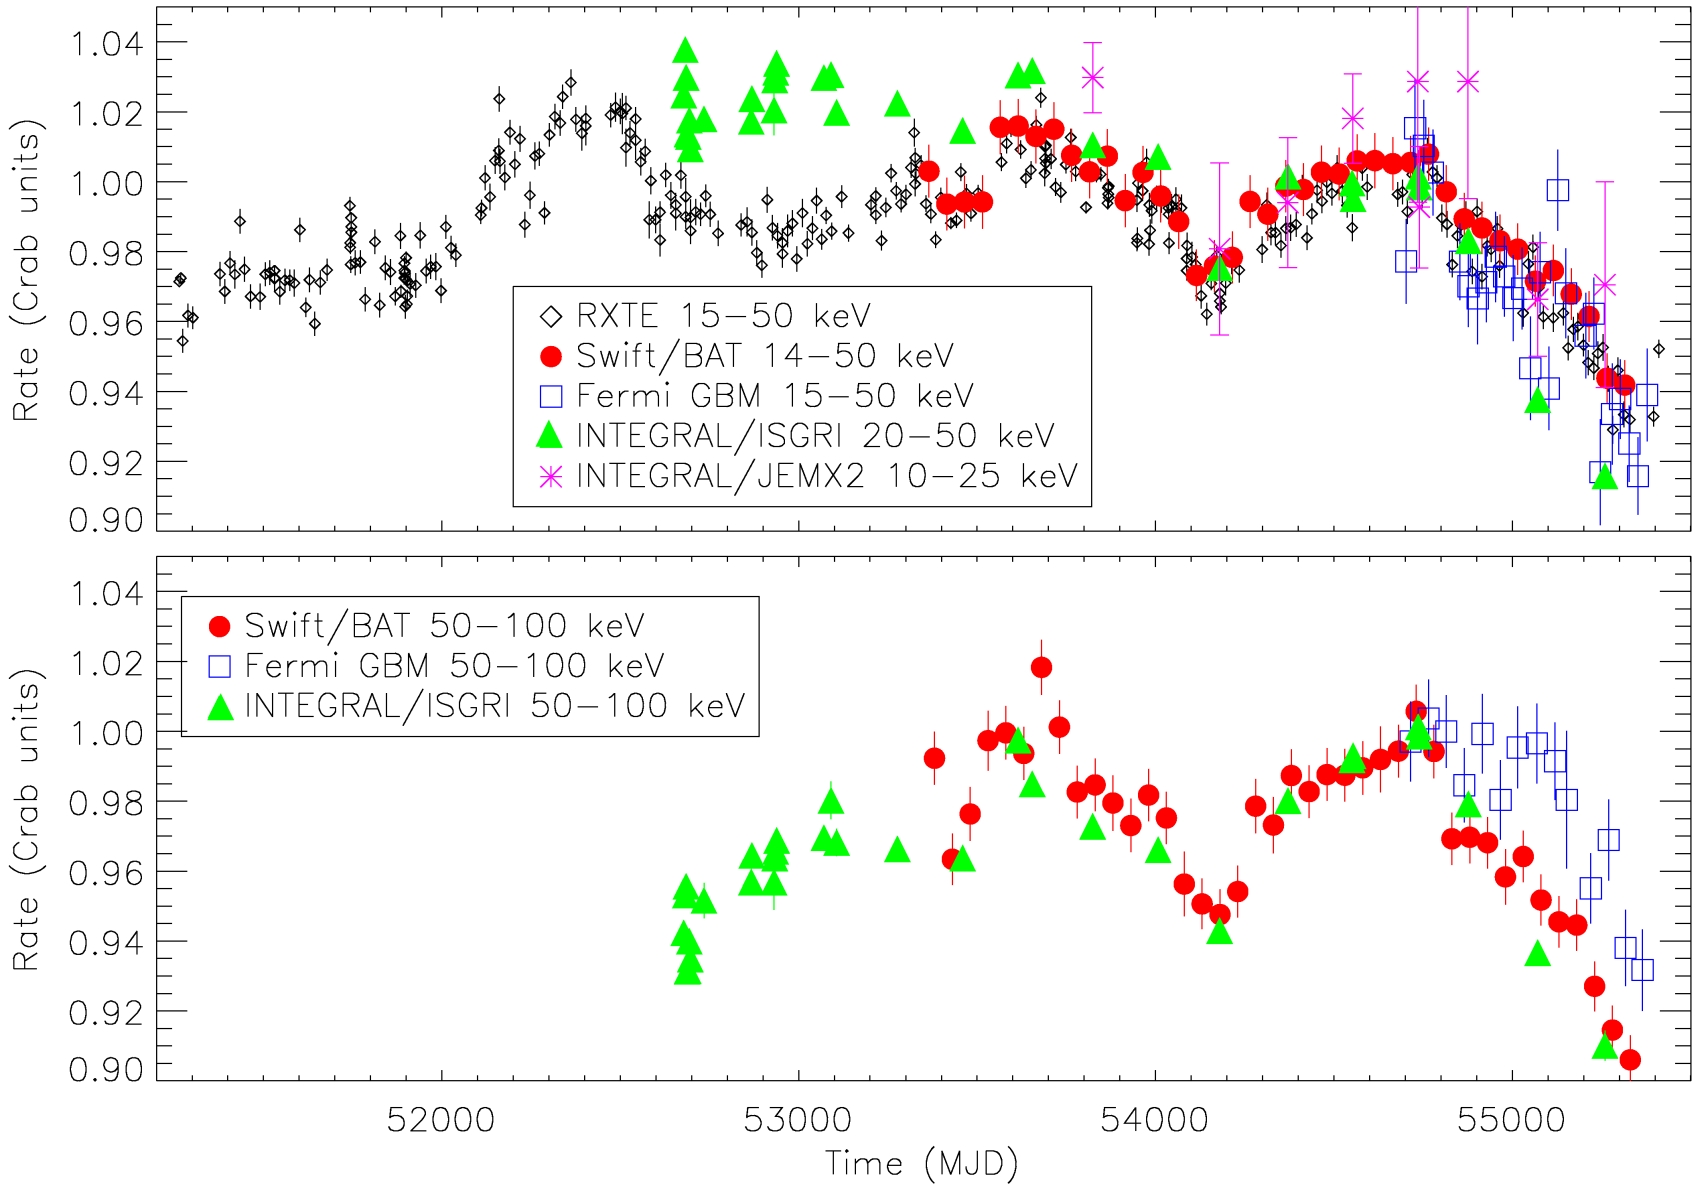
This graph shows the light curve of the Crab Nebula over a time interval of over 10 years, from 1999 to 2010. The data shown in the plot were gathered by NASA's Fermi Gamma-Ray Burst Monitor (Fermi/GBM), Swift Burst Alert Telescope (Swift/BAT), and Rossi X-ray Timing Explorer Proportional Counter Array (RXTE/PCA) as well as two instruments on board ESA's INTEGRAL observatory: the Imager on Board the INTEGRAL Satellite (IBIS) and the Joint European X-Ray Monitor (JEM-X), respectively.
The most interesting part of the figure is at the far right where measurements from all instruments show that the flux of the Crab Nebula is declining, with a current value that is significantly lower than the previous minima observed periodically in the past (left and central part of the graph).