New insights in the auroral electrical circuit revealed by Cluster
9 February 2007
Giant electrical circuits power the magical open-air light show of the aurora, forming arcs in high-latitude regions like Scandinavia. It is known that two different types of electrical circuits, each associated with its own type of electric potential structure, close at low altitude along these arcs, but little was known about the source of this difference. For the first time, two consecutive crossings by two satellites of the ESA/NASA Cluster mission captured the reconfiguration from one type to the other. Published 13 January 2007 in the Journal of Geophysical Research, this result is in agreement with predictions by [Marklund et al., 2004], also based on Cluster data. |
| Image 1. Two green auroral arcs. Credit Jan Curtis |
Auroras appear in many different shapes. The aurora in the early evening sky forms green arcs that stretch across the sky in an east-west direction (Image 1). The longitudinal extent (length) of an auroral arc can be as large as several thousand kilometres, but its width can be as small as 100 metres.
The basic mechanism behind auroral arcs has been known for decades. When (sheets of) highly energetic electrons manage to precipitate into the upper atmosphere, they are stopped by collisions with neutral atoms and molecules, primarily oxygen and nitrogen, at altitudes of a few hundreds kilometres down to 80 km. Each collision transfers part of the electron energy to these atmospheric particles. In turn, they get rid of this energy excess by emitting visible light at specific wavelengths, producing characteristic colours such as green (oxygen) or purple (nitrogen).
Many other aspects of auroral arcs, however, remain poorly understood. In particular: how do electrons causing the bright arcs get accelerated to such high energies? How do the related acceleration process(es) get triggered and how are they maintained? Where do these precipitating electrons come from?
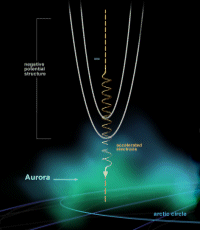
Thanks to scientific rockets, satellites and ground-based experiments, we now know that such precipitating electrons get accelerated on their way down to the upper atmosphere. In other words, an acceleration region exists above the region where auroral arcs shine (Image 2). Satellites flying below such an acceleration region indeed observe energetic electron beams, those responsible for aurorae. Acceleration regions above aurora are found between 5000 and 8000 km of altitude.
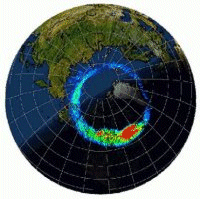
| Animation 1. Artistic view of the analogy between the aurora phenomenon and a TV screen. Electrons are coloured in blue-white and positively charged ions in green (adapted from NASA material). |
In fact, we can draw an analogy between this acceleration region and a TV screen. In an old television tube (forget about recent LCD or plasma TV screens), accelerated electrons hit a phosphorescent screen and cause the phosphor to glow. The acceleration region generating the aurora works similarly; electrons are accelerated on their way down to the ionosphere. After being accelerated, they finally crash into ionospheric atoms and molecules, which become excited and emit the excess energy in the form of auroral light emissions, aurorae (Animation 1). Ground-based measurements of auroral forms and their motions suggested that quasi-static electric fields aligned along the direction of the Earth's magnetic field lines, or parallel electric fields, play an important role in the acceleration of auroral particles. Rocket and satellite measurements later confirmed the existence of such parallel electric fields and the major role they play for the acceleration.
However, these parallel electric field appear in association with either
- bipolar perpendicular electric fields of high magnitude and U-shaped potential structures (Image 2)
- monopolar perpendicular electric fields of high magnitude and S-shaped potential structures
- combinations of the U-shaped and S-shaped potential structures
These electric fields and potential structures can be observed way above the acceleration region, at tens of thousands of kilometres altitude where satellites can measure them. But, why is the profile of intense electric fields sometimes bipolar and sometimes monopolar?
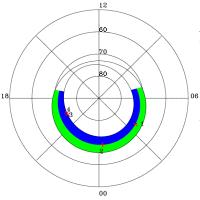
In 2004, Professor Marklund (Alfvén Laboratory, Stockholm, Sweden) and co-authors published the description of 4 electric field events measured at ~32 000 km altitude where U-shaped potential structures were found at the boundary of the central plasma sheet (CPS) and the plasma sheet boundary layer (PSBL) while S-shaped structures were found at the boundary between the PSBL and the polar cap (Image 3). In this paper, Göran Marklund and co-authors proposed a model to explain these observations.
"At the polar cap boundary, the plasma conditions (e.g. the plasma density) are typically more asymmetric (S-shaped) than for particle boundaries within the plasma sheet such as the one between the central plasma sheet and the plasma sheet boundary layer, which should be reflected in the type of the potential structure," wrote Marklund. This result was based on data measured by the four satellites composing the European Space Agency/NASA Cluster mission. In July 2006, a statistical study led by PhD student Tommy Johansson (same institute), also based on Cluster data, confirmed the validity of this model [Johansson et al., 2006].
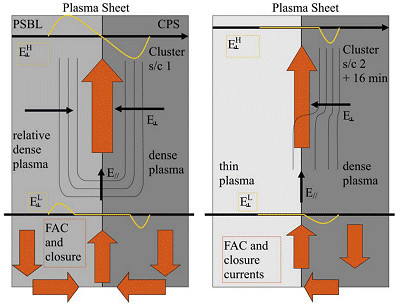
In a recent paper, published 13 January 2007 in the Journal of Geophysical Research, Marklund and co-authors detail a truly significant case study where, for the first time, observation of the transition between the U-shaped to S-shaped is observed. On 1 May 2003, Cluster spacecraft C1 crossed the auroral oval at high altitude in the Earth's magnetotail and detected the presence of a U-shaped potential structure at the boundary between the CPS and the PSBL (Image 4, left panel), as predicted by [Marklund et al., 2004]. Sixteen minutes later, Cluster spacecraft C2, moving along roughly the same orbit as C1, detected S-shaped potential structures (Image 4, right panel), in apparent contradiction with the Marklund model.
However, during this time, the plasma conditions in the PSBL, poleward of the CPS/PSBL boundary, changed dramatically. In particular, the fluxes of energetic electrons decreased, as did the ambient plasma density. These changes were particularly pronounced in a narrow region adjacent to the boundary.
"Thus, the plasma conditions experienced by C2 around the boundary had become more asymmetric, resembling those of the PSBL/polar cap boundary. The reconfiguration of the potential structure from U- to S-shaped is therefore no surprise if you think that the difference of plasma conditions on both sides of the boundary are key to the configuration of the potential structures and of the associated electric current system," says Professor Marklund.
"Once again, the four satellites composing the Cluster mission demonstrate their unique ability to successfully investigate spatio-temporal aspects of auroral plasma physics. It is also a great pleasure to see major progress in our understanding of auroral arcs, one of the most fascinating natural light shows. We are looking forward to Cluster measurements in 2008 and 2009 when the space fleet, due to its orbit evolution, will visit the acceleration region itself," says Philippe Escoubet, Cluster and Double Star project scientist of the European Space Agency.
Contact
Main author
Professor Göran Marklund
Division of space and plasma physics, Alfvén Laboratory, School of electrical engineering, Royal Institute of Technology, Stockholm, Sweden
email: goran.marklund ee.kth.se
phone: +46(0)87907695
Web story author and co-editor
Arnaud Masson
SCI-SO division, RSSD, ESA, The Netherlands
e-mail: Arnaud.Masson esa.int
phone: +31-71-565-5634
Web story co-editors
Philippe Escoubet
SCI-SM division, RSSD, ESA, The Netherlands
e-mail: Philippe.Escoubet esa.int
phone: +31-71-565-4564
Matthew Taylor
SCI-SO division, RSSD, ESA, The Netherlands
e-mail: Matthew.Taylor esa.int
phone: +31-71-565-8009


