Gaia's surprising discoveries – Part 1
Scrutinising the Milky Way
20 April 2018
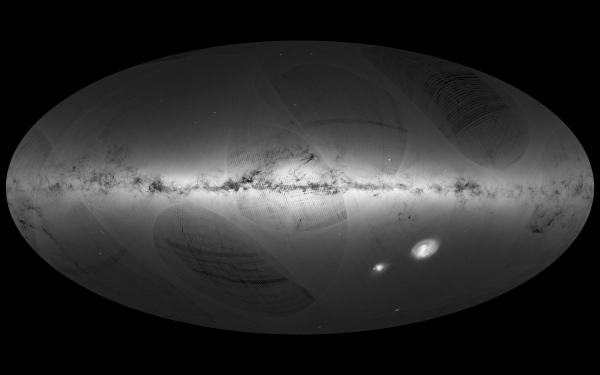
The first data release of ESA's Gaia satellite provided a surprising number of scientific results. Yet it is nothing but a tease for what is expected from the second data release, scheduled for 25 April.Based on 14 months of observations, the initial release was published on 14 September 2016. It included the position and brightness for 1.1 billion stars, and distances and motions for two million of those stars.
Gaia's mission is to create the most accurate map of the Galaxy to date. The 2016 release was a 'test package' designed to allow astronomers to verify that the observing strategy and the data processing 'pipeline' are working well. It succeeded beyond expectations.
It demonstrated the high quality of the scientific data derived from the raw satellite observations by allowing astronomers to publish many new scientific results.
"There are more than 300 refereed papers from the first data release. Gaia has already fundamentally contributed to astronomy," says Timo Prusti, Gaia Project Scientist.
The principal check involved verifying that the stellar parameters derived from Gaia data are scientifically robust and that all effects related to the satellite and instruments are correctly taken into account. To do this, comparisons with the results from previous astrometric catalogues have also been performed.
 |
| Artist's impression of Hipparcos. Credit: ESA |
This has had a rejuvenating effect on the use of those earlier catalogues as the differences between the star positions and other parameters can be used to see how the stars have moved or even evolved in the interim.
Combining the first batch of Gaia data with that from ESA's earlier Hipparcos mission is what allowed the estimate of proper motions (the motion of objects across the plane of the sky) and parallaxes (a measure of the distance) for the two million stars. Without the extra data taken over two decades earlier it would not have been possible to disentangle the effect of parallax and proper motion from the Gaia data available at the time, which covered just over a year.
Inspired by this approach, other astronomers performed other combinations.
Martin Altmann and colleagues derived the movements through space of 583 million stars by comparing the Gaia positions with those of the PPMXL catalogue, a data-set compiled in 2010 from ground-based observations listing positions, proper motions and photometric information of 900 million stars and galaxies. With such data, astronomers can project the stars’ orbits forwards and backwards in time. This allows preditcions of what the Galaxy looked like in the past, and what it will look like in the future.
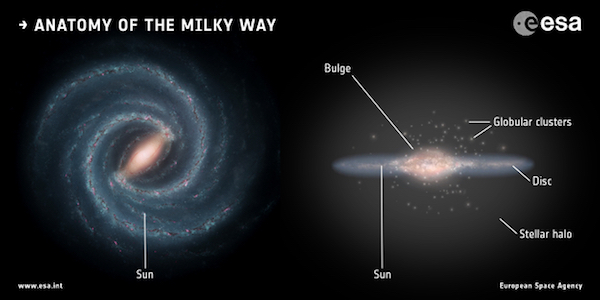
Amina Helmi and colleagues published a study titled “A box full of chocolates” in which they began to reveal the rich structure of the Galaxy’s stellar halo. The halo is the cloud of stars that surrounds the main disc of the Milky Way. Its structure reveals the formation processes of the Galaxy. The investigation of this structure was one of the prime motivations for building Gaia in the first place. An immediate surprise was the discovery of a large population of stars that orbit the Milky Way in the opposite direction to most stars. These `ghost rider’ stars probably came from a smaller galaxy that was cannibalized by the Milky Way.
Another group, led by Ana Bonaca, combined the data with spectroscopic surveys obtained from the ground to investigate an intriguing population of stars in the halo of the Milky Way. The results suggest that these stars have formed in-situ, rather than having been accreted from smaller galaxies, shedding light on the build-up history of our Galaxy.
Looking for pairs of stars that are moving in the same direction with the same speed allowed Semyeong Oh and colleagues to find more than 13,000 new co-moving pairs of stars. They also found some larger associations of stars all moving in the same direction, indicating that they were all born together in the same star cluster.
Some astronomers have attempted to use the Gaia data to better understand stellar evolution. Others have investigated the warp in the disc of the Galaxy.
The first Gaia data release also provided brightness measurements of more than 3000 variable stars – about 10 percent of them newly discovered by Gaia – and the positions and brightness of more than 2000 quasars, which are far distant celestial objects that are used to define the coordinate system for astronomers to reference the sky.
Yet all of this is just the tip of the data iceberg.
"The first release was just a teaser for the second one," says Jos de Bruijne, Gaia Deputy Project Scientist.
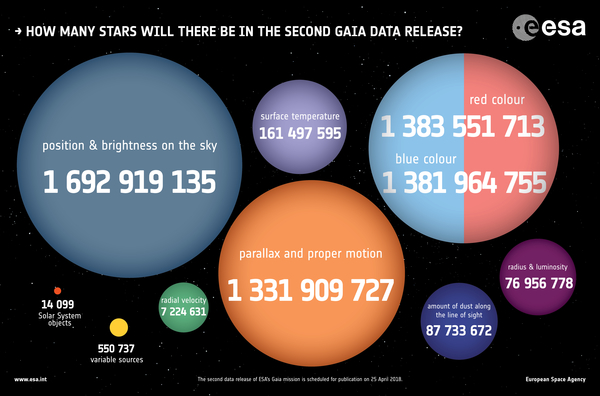
Gaia’s second data release will include positions and brightnesses for nearly 1.7 billion stars, distances, proper motions and colours for 1.3 billion of them, velocities along the line of sight for a subset of seven million, and brightness measurements for half a million variable stars. It also extends the positions and brightnesses to more than half a million quasars, which will allow the celestial reference frame to be fully defined for the first time using optical observations.
 |
| Waiting for Gaia's second data release. Credit: ESA, CC BY-SA 3.0 IGO |
The enormous and challenging task of processing the data and preparing the release was entrusted to the Gaia Data Processing and Analysis Consortium (DPAC), a European consortium of scientists and software experts.
Anthony Brown from Leiden Observatory, Netherlands, is the chair of the DPAC Executive. He explains that to prepare the second release meant processing more than half a trillion data items. This was made up of around 1.7 billion sources, with an average of 20 observations per source and 15 measurements in each observation.
"If I had started counting the Gaia sources, one a second ever since I was born, I would still have five years to go," says Brown who is 48. "That gives you some idea of how many sources we are dealing with."
By the end of the mission, the number of sources could reach two billion and each will have been observed on average 70 times.
Gaia's second release is a truly big data set, and thanks to the practice that astronomers have now had with the first, they are ready to begin studying the new one immediately.
Let the discoveries continue.
| Gaia's surprising discoveries – Part 2: From the Sun's neighbourhood to the distant Universe |
> | |||


