Gaia's sky in colour – equirectangular projection

Date: 25 April 2018
Satellite: Gaia
Copyright: ESA/Gaia/DPAC, CC BY-SA 3.0 IGO
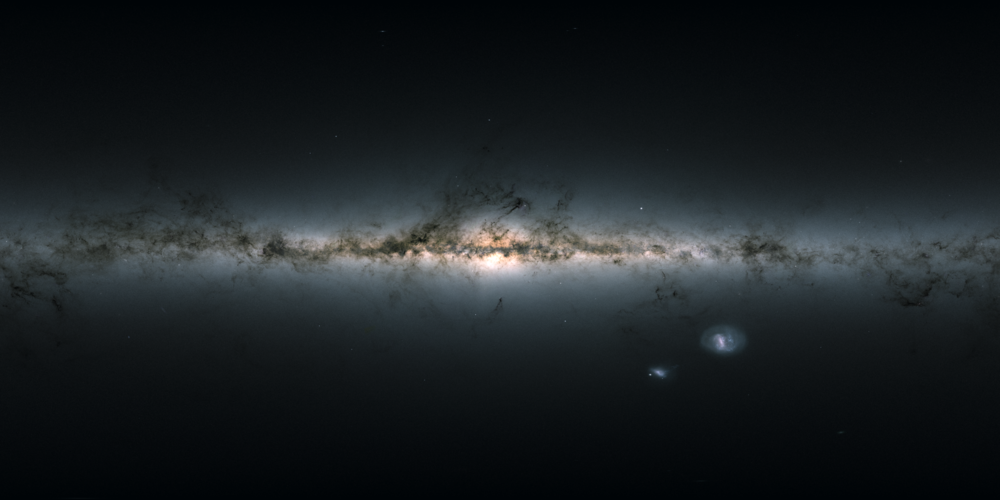
Gaia's all-sky view of our Milky Way Galaxy and neighbouring galaxies, based on measurements of nearly 1.7 billion stars and displayed in an equirectangular projection. It has been obtained by projecting the celestial sphere onto a rectangle and is suitable for full-dome presentations.
The map shows the total brightness and colour of stars observed by the ESA satellite in each portion of the sky between July 2014 and May 2016.
Brighter regions indicate denser concentrations of especially bright stars, while darker regions correspond to patches of the sky where fewer bright stars are observed. The colour representation is obtained by combining the total amount of light with the amount of blue and red light recorded by Gaia in each patch of the sky.
The bright horizontal structure that dominates the image is the Galactic plane, the flattened disc that hosts most of the stars in our home Galaxy. In the middle of the image, the Galactic centre appears vivid and teeming with stars.
Darker regions across the Galactic plane correspond to foreground clouds of interstellar gas and dust, which absorb the light of stars located further away, behind the clouds. Many of these conceal stellar nurseries where new generations of stars are being born.
Sprinkled across the image are also many globular and open clusters – groupings of stars held together by their mutual gravity, as well as entire galaxies beyond our own.
The two bright objects in the lower right of the image are the Large and Small Magellanic Clouds, two dwarf galaxies orbiting the Milky Way. Other nearby galaxies are also visible, most notably the Milky Way's largest galactic neighbour the Andromeda galaxy (also known as M31), seen in the lower left of the image along with its satellite, the Triangulum galaxy (M33).
In small areas of the image where no colour information was available – to the lower left of the Galactic centre, to the upper left of the Small Magellanic Cloud, and in the top portion of the map – an equivalent greyscale value was assigned.
The second Gaia data release was made public on 25 April 2018 and includes the position and brightness of almost 1.7 billion stars, and the parallax, proper motion and colour of more than 1.3 billion stars. It also includes the radial velocity of more than seven million stars, the surface temperature of more than 100 million stars, and the amount of dust intervening between us and of 87 million stars. There are also more than 500 000 variable sources, and the position of 14 099 known Solar System objects – most of them asteroids – included in the release.
A version of this image tagged with meta data to view as a 360° image is available to download here [8192×4096 pixels, 10 MB].
A 360° video of this image is available here.
Acknowledgement: Gaia Data Processing and Analysis Consortium (DPAC); A. Moitinho / A. F. Silva / M. Barros / C. Barata, University of Lisbon, Portugal; H. Savietto, Fork Research, Portugal.
This work is licensed under a Creative Commons Attribution-ShareAlike 3.0 IGO License. 

