Hipparcos' Hertzsprung-Russell diagram

Date: 25 April 2018
Satellite: Gaia
Copyright: ESA/Gaia/DPAC; ESA/Hipparcos; CC BY-SA 3.0 IGO
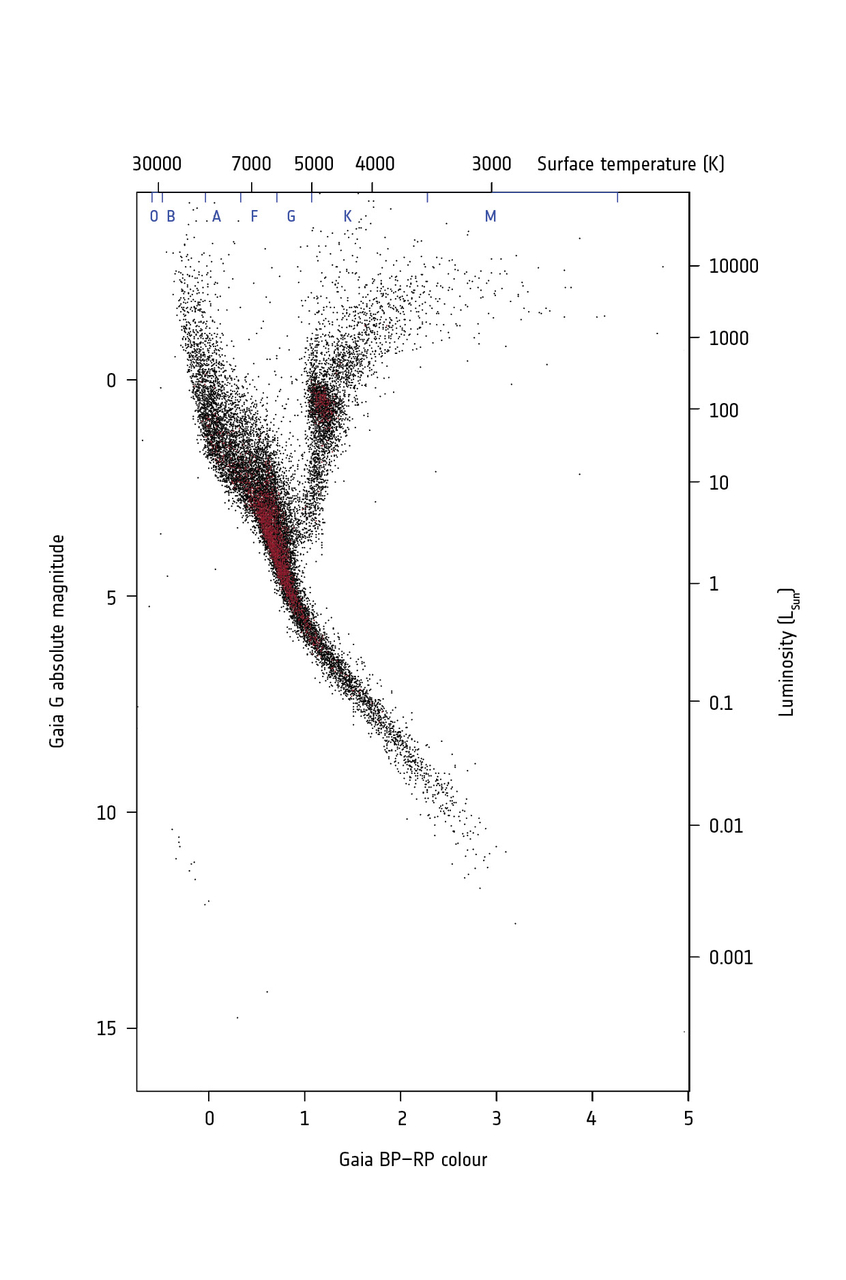
The Hertzsprung-Russell diagram of stars observed by ESA's Hipparcos satellite, rescaled using magnitude and colour units of the ESA Gaia mission, the successor to Hipparcos.
The Hertzsprung-Russell diagram, named after the astronomers who devised it in the early 20th century, is a fundamental tool to study populations of stars and their evolution.
Hipparcos, the first astrometric satellite, was launched in 1989 and operated until 1993. It charted more than 100 000 stars, measuring their distances and motions across the sky.
This diagram shows the absolute magnitude and colour of about 20 000 stars selected from the Hipparcos catalogue.
This image was created to provide a comparison with another Hertzsprung-Russell diagram, obtained using four million stars from the second Gaia data release, published in 2018, and to show the huge leap forward made in the past couple of decades.
Acknowledgement: Gaia Data Processing and Analysis Consortium (DPAC); Carine Babusiaux, IPAG – Université Grenoble Alpes, GEPI – Observatoire de Paris, France.
This work is licensed under a Creative Commons Attribution-ShareAlike 3.0 IGO License. 
