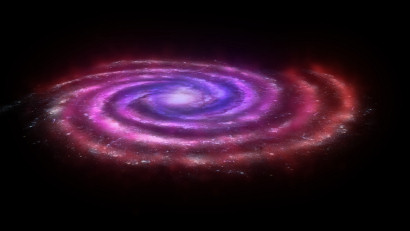
Artist's impression of molecular gas across the Milky Way's plane

Date: 11 June 2013
Satellite: Herschel
Depicts: Distribution of molecular gas across the plane of the Milky Way
Copyright: ESA - C. Carreau
This illustration shows the distribution of molecular gas across the plane of the Milky Way. Molecular gas is the raw material from which stars form and consists mainly of molecular hydrogen (H2), a gas that does not emit any light at the low temperatures found in molecular clouds.
The most widely used proxy to track down molecular gas in star-forming regions is carbon monoxide (CO). A mere contaminant in molecular clouds, CO radiates much more efficiently than H2 and can be detected easily. Observations of CO indicate that molecular gas is most concentrated in the innermost regions of the Galaxy, peaking at a radius of about 13 000 light-years, and declining in density at greater distances. The distribution of molecular gas across the Galaxy as traced by CO is indicated in blue.
However, such indirect tracers can be biased, since there is no guarantee that all portions of a cloud containing H2 also contain CO, in which case observations of CO would miss these regions entirely. To achieve a more complete picture of the Milky Way's molecular content, astronomers have combined observations of CO with other tracers of H2. These studies suggest the presence of more molecular gas in the Milky Way than indicated by CO alone.
New data from ESA's Herschel Space Observatory are now confirming that almost one third of all molecular gas in the Milky Way had remained undetected. The new survey, which probes H2 through a different tracer – ionised carbon (C+) – not only uncovered this hidden pool of material for potential future stars, but also revealed that it is distributed in a curious way.
The CO-dark H2 detected with Herschel is mostly located in a ring surrounding the centre of the Galaxy at radii between 13 000 and 36 000 light-years. The distribution of molecular gas as traced by C+ is indicated in red and extends much farther than that of CO-traced molecular gas.
