Mapping the density waves in Venus' lower thermosphere

Date: 19 April 2016
Satellite: Venus Express
Copyright: ESA/Venus Express/VExADE/Müller-Wodarg et al., 2016
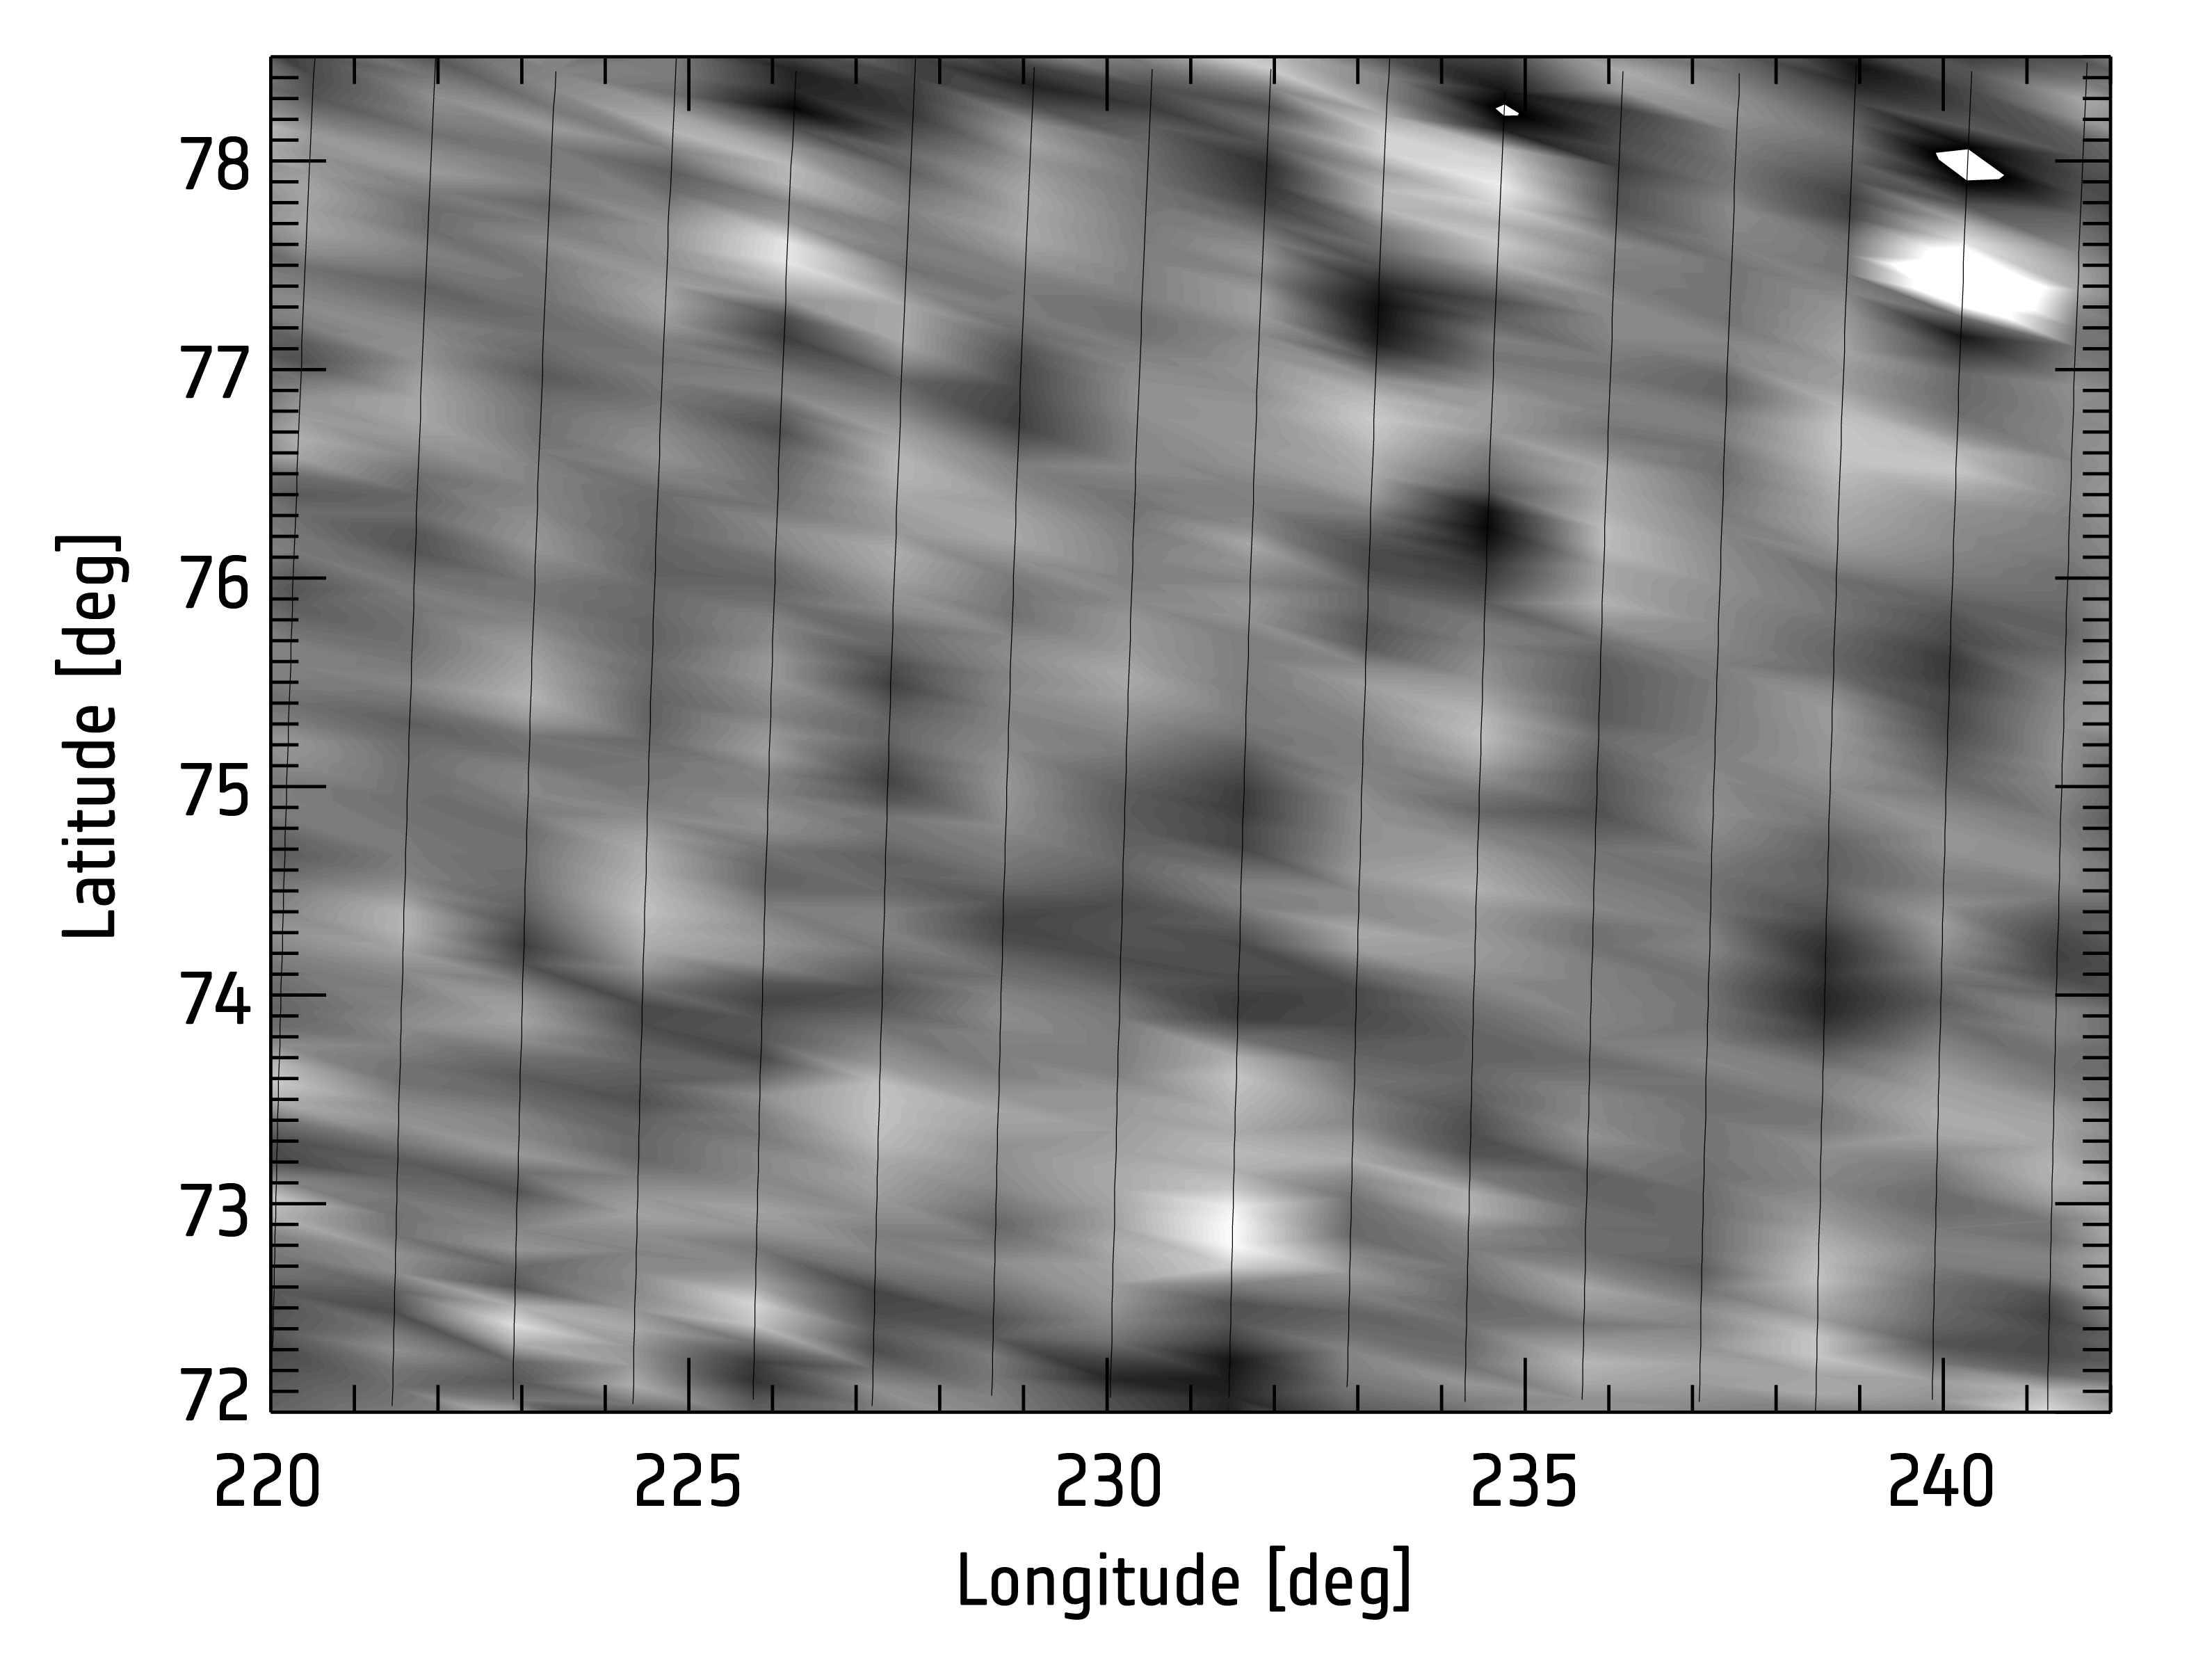
This frame shows a visualization of raw data from the Venus Express Atmospheric Drag Experiment (VExADE), performed from 24 June to 11 July 2014, at altitudes of 130-140 km in the atmosphere of Venus.
The black lines show 16 of the spacecraft's 18 orbital trajectories from that period. The grey background is a normalised map of the atmospheric gravity waves that were detected. The non-uniformity represents density perturbations in Venus' polar atmosphere; darker patches are less dense, and lighter patches more dense, than their surroundings. The average density perturbation amplitude is around 10% of the mean background density.
The results of the VExADE experiment, reported in Nature Physics (Müller-Wodarg et al., 2016), showed that strong atmospheric gravity waves dominate the polar regions of Venus' atmosphere.