Hot spots on neutron stars
22 April 2005
Phase variation in the X-ray emissions from three pulsars has been examined using the EPIC instrument on XMM-Newton. In a paper published this week in the Astrophysical Journal scientists reveal that analysis of spectra over the pulsar rotation period has enabled them to track hot spots on the surface of the neutron star.The spectrum from an object such as a pulsar is made up from a number of components such as:
- Low temperature thermal emission
- High temperature thermal emission
- Non-thermal emission
Each of these components contributes in different amounts to make up the overall spectrum profile. By scaling the relative contributions from each element it is possible to derive the observed spectral profile.
 |
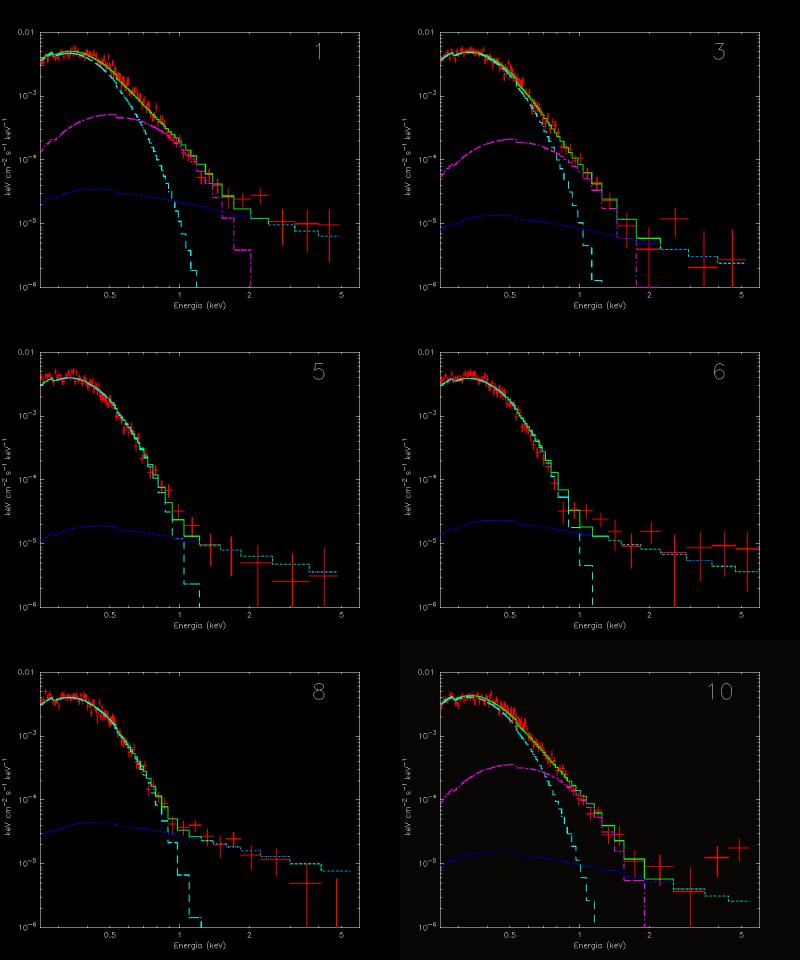
The animation above shows the phase variation of the X-ray emissions detected from PSR 1055-52, a middle aged neutron star (~500 000 thousand years old), located at about 2000 light-years away from us. The star rotates about five times every second.
The star emission has been divided in ten parts, corresponding to one tenth of the star rotation, and spectra have been obtained for each phase interval.
XMM-Newton data is shown in red, lower temperature emissions in green, the higher temperature ‘hot spot’ emission is in violet and non-thermal emissions in blue.
For almost half of the stars' rotation period the violet line disappears as the hot spot region rotates onto the far side.
