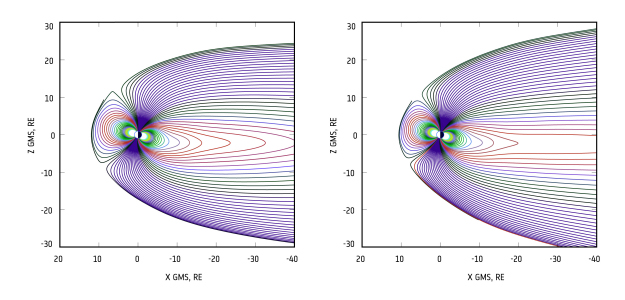
Model magnetosphere field plots

Date: 07 May 2014
Satellite: Cluster
Depicts: Model magnetosphere field plots
Copyright: Images courtesy of N. Tsyganenko
These plots of the magnetospheric field lines, generated from the data-based model of N. Tsyganenko, illustrate the change in configuration arising from changes in the interplanetary magnetic field (B), which is carried by the solar wind to Earth's orbit. In this case, the value of the z component of the field (Bz) was changed from 2 nT (in the left figure) to -8 nT (in the right figure), all other parameters describing the magnetosphere state remained the same. These changes resulted in a closer magnetopause standoff distance (i.e. the dayside magnetospheric boundary shifts closer to Earth), a wider magnetotail, and significantly stretched tail field lines.
The field lines are plotted in units of Earth radii (RE) in the XZ plane of the Geocentric Solar Magnetospheric (GSM) coordinate system. The field lines are colour-coded according to their footpoint latitude, the latter being the location where a geomagnetic field line crosses the Earth's surface.
The data-based model used data from ESA's Cluster mission, as well as from Polar, Geotail and THEMIS, taken during the period 1995-2012. The model can be used to study the constantly changing structure and behaviour of the magnetosphere – the huge magnetic bubble that surrounds Earth.
