First Results from Huygens
17 January 2005
| DISR | |
|
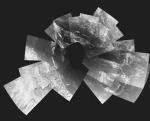
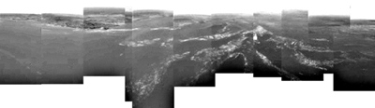
This picture is a composite of 30 images from ESA's Huygens probe. They were taken from an altitude varying from 13 kilometers down to 8 kilometers when the probe was descending towards its landing site. The images have a resolution of about 20 meters per pixel and cover an area extending out to 30 kilometers. Credit: ESA/NASA/University of Arizona |
 |
15 January 2005
| DISR | |
|
Composite images shows three dimensional structure | |
|
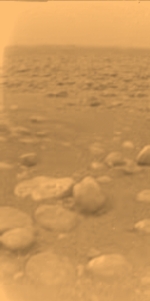
This image was returned yesterday, 14 January 2005, by ESA's Huygens probe during its successful descent to land on Titan. This is the coloured view, following processing to add reflection spectra data, gives a better indication of the actual colour of the surface. Initially thought to be rocks or ice blocks, they are more pebble-sized. The two rock-like objects just below the middle of the image are about 15 centimetres (left) and 4 centimetres (centre) across respectively, at a distance of about 85 centimetres from Huygens. The surface is darker than originally expected, consisting of a mixture of water and hydrocarbon ice. There is also evidence of erosion at the base of these objects, indicating possible fluvial activity Credit: ESA/NASA/University of Arizona |
 |
| A composite image showing a full 360-degree view around Huygens. The left-hand side, behind Huygens, shows a boundary between light and dark areas. These images were taken from an altitude of about 8 kilometres with a resolution of about 20 metres per pixel. Credits: ESA/NASA/University of Arizona |
 |
|
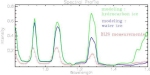
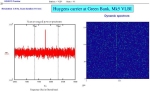
This graph shows a spectrum, displaying the intensity of solar light reflected by the surface of Titan as a function of wavelength (colour). |
 |
| GCMS | |
|
Detailed analysis of methane | |
| HASI | |
|
Data collected from entry covering the full deceleration of the probe and conducting a full analysis of the atmospheric structure. | |
| SSP | |
|
Recovered 3 hours 37 minutes of data, including 1 hour 10 minutes on the surface. | |
|
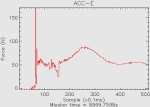
Data from the SSP Accelerometer showing the force experienced by Huygens as it landed on the surface. Credit: ESA/NASA/JPL/Open University |
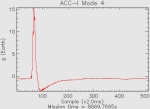 |
|
Data from the SSP Penetrometer experiment showing the applied force. Scientists believe the data shows the surface to have some kind of thin crust covering a less dense sub-surface material. Credit: ESA/NASA/JPL/Open University |
 |
| Radio Experiments | |
|
By using VLBI techniques 18 radio observatories around the world were able to track the descent of the Huygens probe. This will allow scientist to determine the position of Huygens to within a few kilometres and wind speed to a few metres per second. | |
|
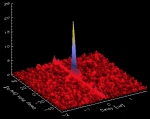
Carrier signal detected by Green Bank 110m radio telescope, USA. Credit: ESA/NASA/JPL/JIVE |
 |
|
Carrier signal detected at Parkes-Mopra radio observatory, Australia. Credit: ESA/NASA/JPL/JIVE |
 |
14 January 2005
| DISR | |
|
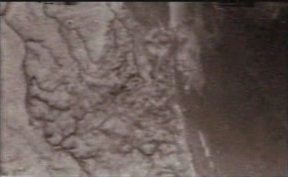
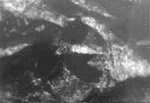
Taken at an altitude of 8 kilometres with a resolution of 20 metres per pixel the image shows what could be the landing site, with shorelines and boundaries between raised ground and flooded plains. Credit: ESA/NASA/University of Arizona |
 |
|
Taken from an altitude of 16.2 km this image has a resolution of around 40 m per pixel. It shows possible drainage channels and a shoreline Note - this image is unprocessed. Credit: ESA/NASA/University of Arizona |
|
|
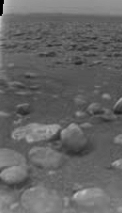
An unprocessed image of Titan's surface at the Huygens probe landing site showing what are believed to be small sized blocks of ice. Credit: ESA/NASA/University of Arizona |
|