Titan Flyby - 22 July 2006
19 July 2006
Only 20 days after Titan-15, Cassini returns to Titan for its seventeenth targeted encounter, Titan-16. The closest approach to Titan occurs on Saturday, 22 July, at 00:25 UT at an altitude of 950 kilometres above the surface and at a speed of 5.8 kilometres per second. The latitude at closest approach is 85° (near polar) and the encounter occurs on orbit number 26.This encounter is set up with two manoeuvres: an apoapsis manoeuvre on 10 July, and an approach manoeuvre, scheduled for 18 July. This inbound encounter occurs about 2 days before Saturn closest approach.
Science Activities
- Cassini Radar (RADAR)
One of the high priority RADAR SAR passes. High resolution over Titan's arctic (high northern latitudes) and down to its tropics at two longitudes. This will be the first view of the northern latitudes, which is currently in perpetual winter darkness. Titan's northern terrain could harbor methane lakes, which shrink in summer and expand in winter. - Ion and Neutral Mass Spectrometer (INMS)
T16 is one of the lowest passes currently planned in the mission, and one of the best ride-along observations for INMS. - Ultraviolet Imaging Spectrograph (UVIS)
UVIS will observe the star Alpha Virgo as it passes behind Titan's atmosphere. UVIS objectives are to measure vertical and horizontal profiles for N2, methane and other hydrocarbons. To determine the temperature and photochemistry of the upper atmosphere, and measure haze optical and physical properties and altitude/latitude distribution. - Magnetospheric and Plasma Science (MAPS)
In general the MAPS observations at T16 are the first in a series (T16-T24) of flybys in the pre-dawn sector. This is a good opportunity to do comparison observations and correlation between the data sets. - Visual and Infrared Mapping Spectrometer (VIMS)
VIMS has inbound and outbound observations that are searching for mid-latitude clouds. There are some high resolution observations at approximately 25° latitude, 110° longitude. - Composite Infrared Spectrometer (CIRS)
CIRS will focus on the northern polar limb, this time at 45° north. Inbound, there is a mid-IR composition limb integration at highest spectral resolution. Outbound, CIRS will perform a far-IFR limb composition at the same latitude, later followed by a mid-IR limb temperature map over the winter polar vortex boundary region (30°-75° north). CIRS will finish up with a slow scan across the disk for surface temperature and aerosol mapping.
Table of Events
17 July 2006
| Time UTC | Time wrt Titan-16 |
Activity |
| 00:06:00 | -05d 00h | Start of Sequence S22 which contains Titan-16 |
18 July 2006
| Time UTC | Time wrt Titan-16 |
Activity |
| 14:51:00 | -03d 10h | OTM #67 Prime, Titan-16 minus 3 day targeting manoeuvre |
19 July 2006
| Time UTC | Time wrt Titan-16 |
Activity |
| 14:51:00 | -02d 10h | OTM #67 Backup |
20 July 2006
| Time UTC | Time wrt Titan-16 |
Activity |
| 23:51:00 | -01d 01h | Start of the TOST Segment |
| 23:51:00 | -01d 01h | Turn cameras to Titan |
21 July 2006
| Time UTC | Time wrt Titan-16 |
Activity |
| 00:21:00 | -01d 00h | Deadtime, used to accommodate changes in flyby time |
| 00:36:00 | -23h 49m | Infrared (IR) global mapping; search for and characterize clouds |
| 15:25:00 | -09h 00m | Far IR limb observation; stratospheric studies |
| 17:25:00 | -07h 00m | IR high resolution imaging; regional mapping of surface |
| 19:06:00 | -05h 19m | Turn RADAR toward Titan |
| 19:15:00 | -05h 10m | RADAR radiometry; studies of surface properties |
| 22:42:00 | -01h 43m | RADAR scatterometry; surface roughness and composition studies |
| 23:33:00 | -00h 52m | Transition to thrusters; study surface and sub-surface properties |
| 23:55:00 | -00h 30m | RADAR Altimetry; studies involving altitude of surface features |
22 July 2006
| Time UTC | Time wrt Titan-16 |
Activity |
| 00:16:00 | -00h 09m | Titan wake crossing |
| 00:18 | -00h 07m | RADAR synthetic aperature radar; high resolution coverage of high northern latitudes |
| 00:10 | -00h 15m | Ion & Neutral Mass Spectrometer; determine the atmospheric & ionospheric thermal structure |
| 00:10 | -00h 15m | Magnetospheric & Plasma Science activities; analysis of plasma wake, ions escaping from Titan, and Titan's interaction with Saturn's magnetosphere |
| 00:25:00 | +00h 00m | Titan-16 flyby closest approach time. Altitude=950 km, speed=5.8 km s-1, 105° phase at closest approach |
| 00:55:00 | +00h 30m | Ultraviolet stellar occultation; high altitude atmospheric studies |
| 01:03:00 | +00h 38m | Transition back to reaction wheels |
| 01:40:00 | +01h 15m | Far IR limb observations; study of stratospheric compounds |
| 02:40:00 | +02h 15m | Far IR stares; surface and tropopause temperature and methane abundance |
| 07:40:00 | +07h 15m | IR cloud observations; cloud mapping & lightning search |
| 13:14:00 | +12h 49m | Deadtime, used to accommodate changes in flyby time |
| 13:30:00 | +13h 05m | Turn to Earth-Line |
| 14:00:00 | +13h 35m | Begin playback of T16 data, Goldstone 70M |
| 23:36:00 | +23h 11m | End playback of T16 data |
Observation Results
Cassini Instrument: Visual and Infrared Mapping Spectrometer (VIMS)
|
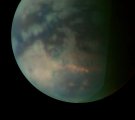
Date: 13 September 2006 Credit: NASA/JPL/University of Arizona Image Notes: Outbound view of Titan, composed of images at 5 (red), 2 (green) & 1.2 (blue) μm. Clouds are seen along the latitude 40° S, just below image centre. |
 |
|
Date: 13 September 2006 Credit: NASA/JPL/University of Arizona Image Notes: Crescent view of Titan, composed of images at 5 (red), 2 (green) & 1.26 (blue) μm. Image taken at a distance of 15 700 km. |
 |
Cassini Instrument: Imaging Science Subsystem (ISS)
|
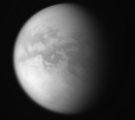
Date: 18 August 2006 Credit: NASA/JPL/Space Science Institute Image Notes: This wide angle camera view shows Titan's characteristically dark mid-latitudes. Image was obtained from 148 000 km out, in polarized infrared light. |
 |
Cassini Instrument: Synthetic Aperture Radar (SAR)
|
Date: 16 February 2007 Credit: NASA/JPL Video Notes: Animation of SAR mosaic of data gathered during three flyby's over Titan's north polar region, with the up to 100 km wide radar-dark patches. |
 |
|
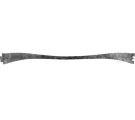
Date: 11 January 2007 Credit: NASA/JPL Image Notes: Complete SAR strip over Titan's northern hemisphere from which the below close-ups were taken showing the discovery of evidence of hydrocarbon lakes |
 |
|
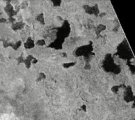
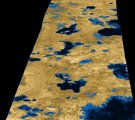
Date: 4 January 2007 Credit: NASA/JPL/USGS Image Notes: Strong evidence of hydrocarbon lakes on Titan at high northern latitudes. False-colour strip, 140 km wide. Centred near 80° N. |
 |
|
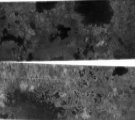
Date: 24 July 2006 Credit: NASA/JPL Image Notes: Strong evidence of hydrocarbon lakes on Titan at high northern latitudes. Top image at ~80° N, 92° W, ~420 km × 150 km. Lower image centred near 78° N, 18° W, ~ 475 km × 150 km. |
 |
