MHD Simulation of a Kelvin-Helmholtz Wave
 Date: 05 December 2006
Satellite: Cluster
Depicts: Kelvin-Helmholtz simulation plot
Show in archive: true
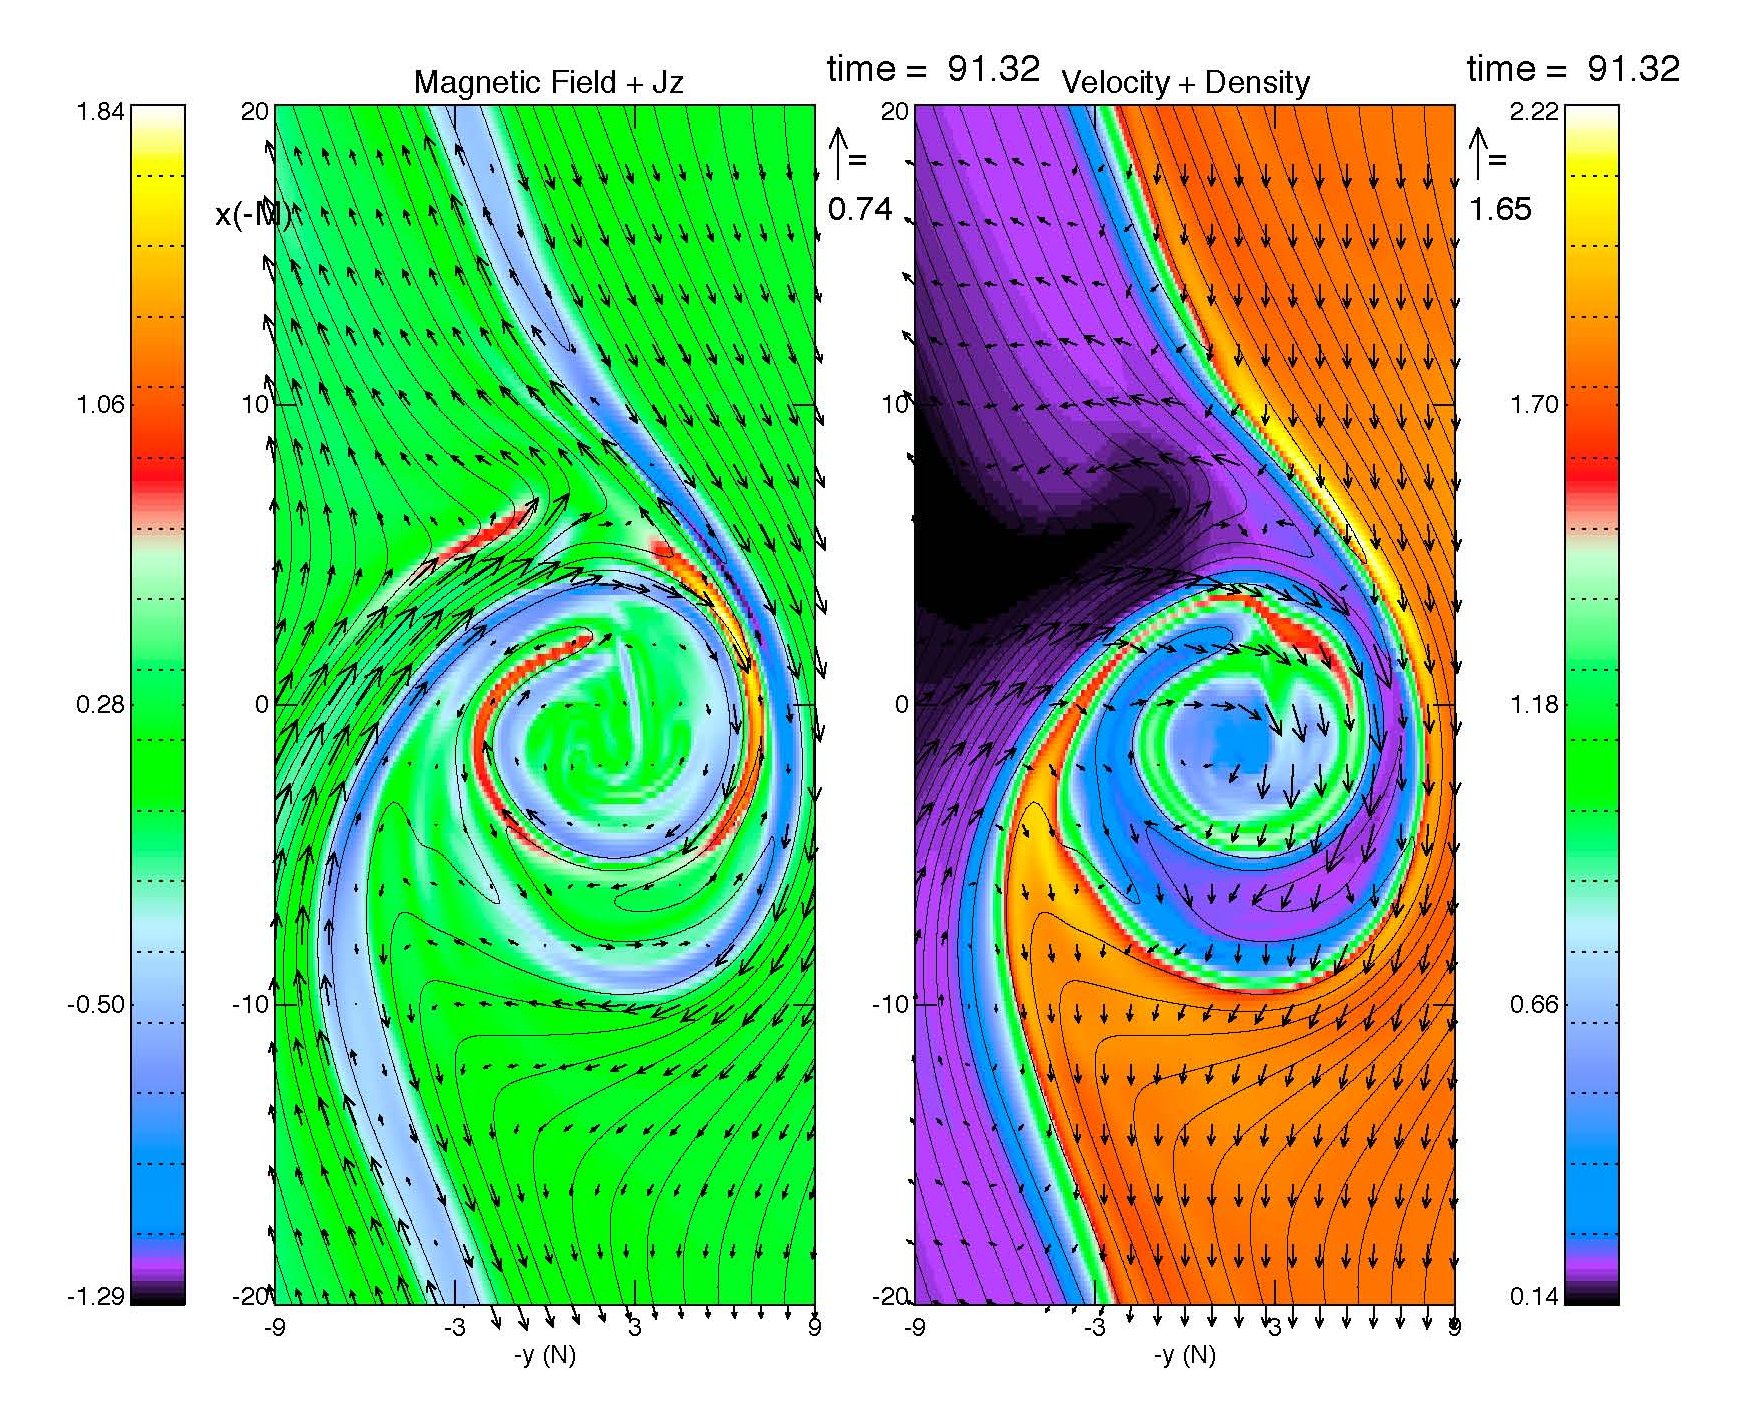
Magneto-Hydro Dynamic simulation result of the Kelvin-Helmholtz wave at t=410 s. The magnetic field (arrows) and the z-component of the current density Jz (colour coded) are plotted on the left panel. The right panel represents the velocity (arrows) and the density (colour coded). The black lines are magnetic field lines.
Courtesy of Dr. Nykyri, Imperial College, UK
Date: 05 December 2006
Satellite: Cluster
Depicts: Kelvin-Helmholtz simulation plot
Show in archive: true
Magneto-Hydro Dynamic simulation result of the Kelvin-Helmholtz wave at t=410 s. The magnetic field (arrows) and the z-component of the current density Jz (colour coded) are plotted on the left panel. The right panel represents the velocity (arrows) and the density (colour coded). The black lines are magnetic field lines.
Courtesy of Dr. Nykyri, Imperial College, UK
Last Update: 1 September 2019