Herschel spectrum of the Clone

Date: 29 April 2014
Satellite: Herschel
Copyright: ESA/Herschel/HIFI. Acknowledgments: James Rhoads and Sangeeta Malhotra, Arizona State University, USA
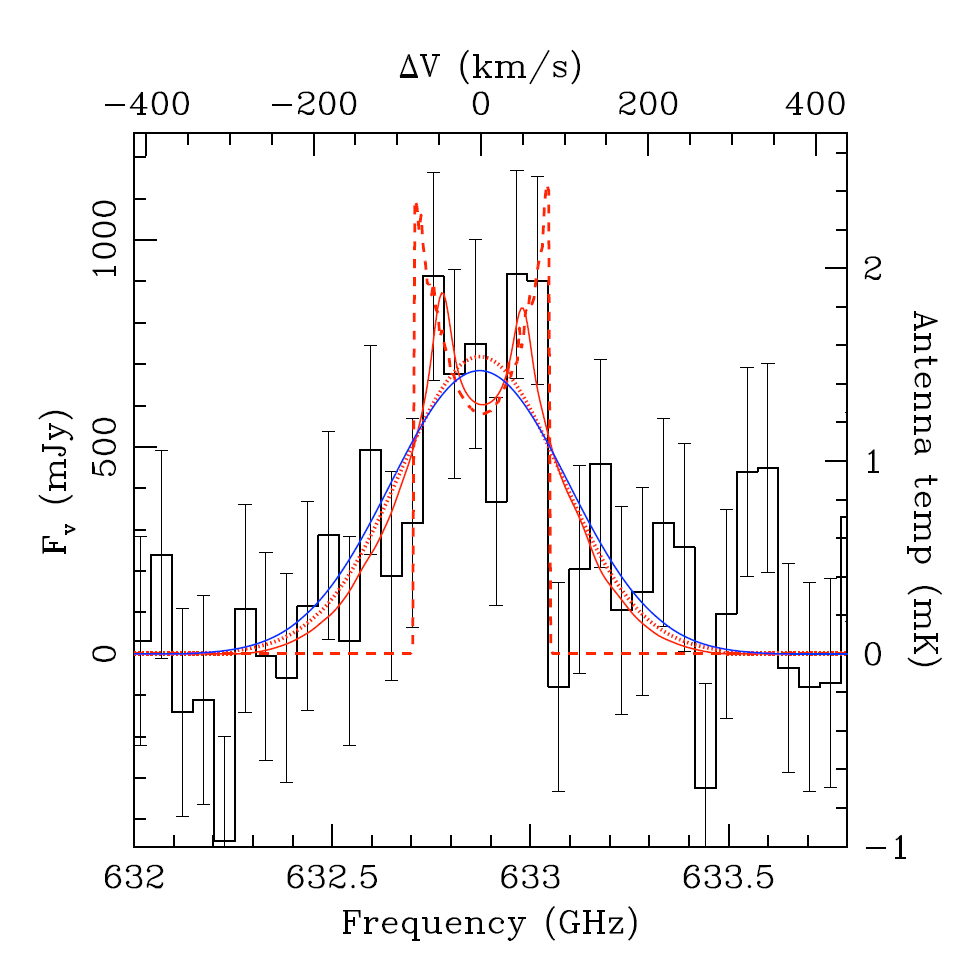
Herschel spectrum for SDSS J120602.09+514229.5 (the Clone). Here, the data are noisier than for S0901 and the emission line of ionized carbon (at 158 micrometres) can be fitted in a number of ways. The dashed red line and the solid red line show double-peaked profiles that indicate little turbulence in the galaxy. The red dotted line and the blue solid line show models in which turbulence plays a dominant role in the galaxy. Statistically, the best fit is the solid red line, which is double peaked.
Last Update: 1 September 2019