Exploring planetary plasma environments from your laptop
14 June 2018
A new database of plasma simulations, combined with observational data and powerful visualisation tools, is providing planetary scientists with an unprecedented way to explore some of the Solar System's most interesting plasma environments.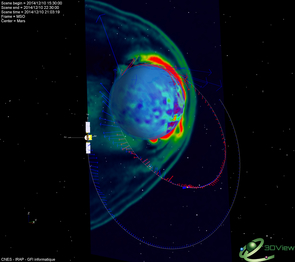 |
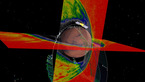
| Visualisation of Mars' plasma environment. Credit: CNES/IRAP/GFI informatique; LatHyS; 3DView |
This digital space exploration story starts with the Integrated Medium for Planetary Exploration (IMPEx), a collaborative project to create a common data hub for space missions.
While planetary missions are crucial to understand how the solar wind interacts with the magnetospheres of planets and moons in our Solar System, numerical models are, in turn, essential to fully comprehend the measurements and improve our knowledge of planetary plasma environments.
The IMPEx project brought together experts from Austria, France, Finland and Russia to find a common language to combine data from various simulation models and to compare these numerical results with observational data collected by space missions across the Solar System.
It was in this context that a group led by Ronan Modolo at the Laboratoire Atmosphères, Milieux, Observations Spatiales (LATMOS), in France, started developing a collection of plasma simulations at various planetary bodies. The Latmos Hybrid Simulation (LatHyS) database and its uses are presented in a new study published earlier this year in a special issue of Planetary and Space Science.
Modelling celestial environments
The LatHyS database includes a number of simulation results of plasma – the mixture of charged particles that permeates interplanetary space – at selected planets or planetary bodies in our Solar System. The simulations are based on advanced numerical models that take into account a number of complex physical and chemical processes in the upper atmospheres of celestial objects, their interaction with the solar wind and response to solar radiation.
"So far, celestial objects modelled by LatHyS simulations include Mars, Mercury and Jupiter's moon, Ganymede," explains Modolo. "We are planning to extend this database to other objects like Saturn's moon Titan and, in the longer term, to other moons of Jupiter, like Europa or Callisto," he adds.
The database gives the planetary science community access to simulated plasma data, including electric and magnetic fields, density, temperature and plasma bulk speed. LatHyS, together with a suite of data analysis and visualisation tools, allows researchers to easily combine data from various spacecraft with simulation results, to create 3D images showing how the solar wind interacts with planetary plasma, and much more.
"With a few clicks, the user can get a realistic three-dimensional scene of the plasma environment at the planet and of the spacecraft trajectory, with in-situ measurements enriched by simulation results," says Dmitri Titov, ESA Mars Express project scientist and a user of the database, who was not involved in the study.
"Users can also use this tool to create animations and, on the scientific side, to visualise the measurements in the context where they had been performed and assist in planning future observations."
To show how useful LatHyS and its associated 3D visualisation tools can be in helping understand planetary plasma environments, Modolo and his team presented a science case in their new study focusing on Mars. They used observational data from ESA's Mars Express, a mission that has been exploring the Red Planet since 2003, probing its plasma environment in unprecedented detail. They also relied on data from a second Mars orbiter equipped with a plasma instrument: NASA's Mars Atmosphere and Volatile Evolution Mission (MAVEN), which arrived at Mars in 2014 and has been studying the planet's plasma environment and its interaction with the solar wind in close collaboration with Mars Express ever since.
| Animated simulation of Mars' plasma environment. Click here for details and large versions of the video. Credit: CNES/IRAP/GFI informatique; LatHyS; 3DView |
For the new study, the researchers combined and compared data from MAVEN and Mars Express with the LatHyS simulation results. By combining the simulations with observational data and the orbits of the two spacecraft using 3DView – a 3D visualisation tool that was also developed in the framework of IMPEx – they could analyse in a new way how the solar wind interacts with the Mars upper atmosphere.
While the science case focused on the Red Planet and on the Mars Express and MAVEN missions, the database can be used to explore other bodies in the Solar System, comparing simulation results with observation data from other space missions.
"All planetary missions with plasma instruments – past, present and future – can be potentially used, but for the time being we focus on those dedicated to Mars, Mercury, and Ganymede," says Modolo.
This includes ESA's Rosetta, which flew by Mars in 2007 on its way to Comet 67P/Churyumov-Gerasimenko, and, in the future, BepiColombo and JUICE, the JUpiter ICy moons Explorer. The Mercury Magnetospheric Orbiter and the Mercury Planetary Orbiter on the ESA-JAXA BepiColombo mission will explore different regions of Mercury's plasma environment, while ESA's JUICE has Ganymede, the largest moon of Jupiter, as one of its main targets.
Modolo looks to future missions since LatHyS, combined with visualisation tools, can help plan for them.
"These applications can be used to support the analysis of in-situ observations and also help prepare and optimise the scientific return of future missions," he adds.
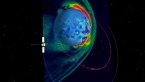
| Animated simulation of Mercury's plasma environment. Click here for details and large versions of the video. Credit: CNES/IRAP/GFI informatique; LatHyS; 3DView |
Seeing the Solar System in 3D
A strength of LatHyS is how well it works with 3DView, a powerful application for displaying science data in 3D. In the current version of the viewer, users can visualise spacecraft trajectories, the positions of planets and other Solar System bodies, among other features. More importantly, because of the integration with IMPEx and LatHyS, 3DView can display scientific data from multiple space missions, as well as from simulations. A new paper led by Vincent Génot of the Institut de Recherche en Astrophysique et Planétologie (IRAP) in Toulouse, France, published in the same issue of Planetary and Space Science, introduces the latest version of the tool and describes in detail how it can be used to display space physics data.
3DView, designed by the French Plasma Physics Data Center (CDPP), was initially developed in 2005 to visualise the trajectory of ESA's Rosetta spacecraft on its way to the comet. The viewer now comprises some 150 space missions, including Rosetta, Venus Express, and Cassini–Huygens, as well as all planets and moons in the Solar System and a number of asteroids and comets.
"3DView offers the possibility to visualise spacecraft ephemerides – of past, present and future missions – and, when available, observations at all celestial objects in the Solar System explored by space missions equipped with plasma instruments," says Génot.
One of the main applications of the tool, also in combination with LatHyS, is in helping scientists and engineers during the preparation stages for space missions, allowing them to visualise spacecraft trajectories and the environment at celestial bodies. In 2014, a version of 3DView helped scientists in the selection process of a landing site at Rosetta's comet for the Philae probe.
A science case presented in this study features ESA's future mission, JUICE, which is planned for launch in 2022. The researchers combined observations of Ganymede done by NASA's Galileo mission a couple of decades ago with LatHyS simulations of the plasma environment at this Jupiter moon. JUICE scientists have used 3DView in a similar way, to analyse simulations at Ganymede and gather information, such as times for closest approaches or magnetopause crossings, about future fly-bys of the moon by JUICE.
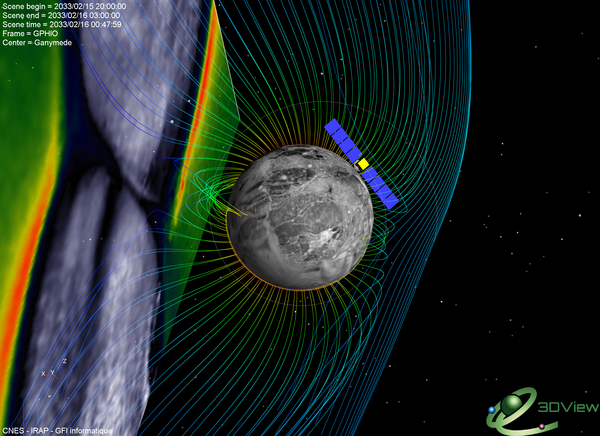 |
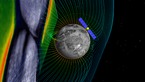
| Visualisation of the ionised environment of Ganymede. Credit: CNES/IRAP/GFI informatique; LatHyS; 3DView |
"The 3DView tool is useful to visualise the trajectory of JUICE in the Jupiter system and also to visualise the 'invisible' magnetospheric boundaries," says ESA's JUICE Project Scientist Olivier Witasse.
While its main target audience is the scientific community, 3DView is also attracting attention as an educational tool. The code is open source and the software is often used in higher-education courses to help students have a better grasp of space physics.
From providing new ways to explore our Solar System to planning future missions and inspiring the next generation of space researchers, LatHyS and 3DView show how much scientists and engineers can gain from combining observations and simulations.
Notes
The Integrated Medium for Planetary Exploration (IMPEx) was funded under the European Commission FP7 programme between 2011 and 2015.
For more information, please contact:
Ronan Modolo
Laboratoire Atmosphères, Milieux, Observations Spatiales (LATMOS)
Velizy, France
Email: ronan.modolo![]() latmos.ipsl.fr
latmos.ipsl.fr
Vincent Génot
Institut de Recherche en Astrophysique et Planétologie (IRAP)
Toulouse, France
Email: vincent.genot![]() irap.omp.eu
irap.omp.eu
Dmitri Titov
ESA Mars Express project scientist
European Space Agency
Email: dmitri.titov![]() esa.int
esa.int
Olivier Witasse
ESA JUICE project scientist
European Space Agency
Email: olivier.witasse![]() esa.int
esa.int