Third Close Titan Flyby
16 February 2005
The third close flyby of Titan occurred on Tuesday, 15 February 2005 at 6:58 UTC. At closest approach, Cassini passed within 1.6 Titan radii, at an altitude of 1577 km above the surface and at a speed of 6.1 kilometres per second.The encounter was set up with two manoeuvres: an apoapsis manoeuvre on 1 February, and a Titan approach manoeuvre, on 12 February. Titan-3 is an inbound flyby, with Saturn periapsis occurring about two days after closest-approach, on 17 February.
Titan-3 is Cassini's fourth targeted satellite encounter. The first was Phoebe, on 11 June, at an altitude of 2000 km. The second was Titan-A, on 26 October, at an altitude of 1200 km and the third was Titan-B, on 13 December at an altitude of 1200 km.
Science Activities
The Cassini/Huygens project is interested in four broad science themes concerning Titan: its interior structure, surface characteristics, atmospheric properties, and interaction with Saturn's magnetosphere. At an altitude of 1577 km, Titan-3 could not provide direct measurements of the density of Titan's atmosphere.
- CAPS made measurements of Titan's upper ionosphere and gathered science from Cassini's crossing through Titan's plasma wake. Both ion and electron measurements were made during the flyby. CAPS closely examined the interaction between Titan and Saturn's Magnetosphere.
- CIRS performed two 4-hour limb integrations using the mid-IR detectors to search for new molecules in the stratosphere. The campaign of far-IR integrations (begun on T0) was also continued to search for species at longer wavelengths, and obtain a thermal map of the stratosphere, lending insight into the dynamics of Titan's atmosphere.
- ISS was planned to do a full-disk mosaic, that covers much of the leading and anti-saturnian hemispheres (including Xanadu) at multiple wavelengths to observe the surface and atmosphere, a 5x5 mosaic that covers western Xanadu and the dark area to the west, and two footprints designed to coincide with points along the T03 RADAR altimetry and SAR observations. It is the first joint coverage of the same site by ISS, and VIMS, who was riding along, and RADAR-altimetry/SAR. ISS also had a number of ride-along observations, including outbound observations of Titan's night side.
- RPWS studied the interaction of the magnetosphere with Titan at intermediate distances for evidence of ion pickup, radio emissions, density profiles, and the general wave environment. Given the approximate similarity of the T3 flyby geometry to that of Ta and Tb, RPWS will concentrate on variations between the three flybys. Already, a significant difference has been observed in the inbound vs. outbound asymmetry of the plasma density when comparing the Ta and Tb results. RPWS used a somewhat modified instrument configuration to concentrate on lower-frequency plasma waves associated with the magnetosphere-Titan interaction and to fine-tune the Langmuir Probe thermal plasma measurements.
- RADAR controlled spacecraft attitude for the two hours around closest approach, beginning 046T06:19. During that time, RADAR performed SAR Imaging including the first real 'bright terrain', which includes part of Xanadu to be the subject of joint ORS/RADAR investigation. RADAR Altimetry measurements taken during T3 are to establish whether the lack of topography identified during the Titan-A flyby was atypical.
- MAG investigated the large-scale and distant aspects of the Titan interaction by observing during the entire period around an encounter from 10 to 25 Saturn Radii (03TI (T3)). T3 completed the triad of close flybys at almost the same Saturnian local time just before local noon in the magnetospheric wake region of Titan. This provides a data set Ta,Tb,T3 to describe and understand the formation of Titan's induced magnetic tail in three dimensions.
- MIMI investigated micro-scale and near aspects of the Titan interaction by observing during an approximately one hour period around the encounter. With -Y pointed toward Titan, within 30 minutes of the targeted flyby, the secondary axis was optimised for co-rotation flow as close to the S/C -X, +/- Z plane as allowed by the other constraints on pointing. Also, Titan's exosphere/magnetosphere interaction was measured by imaging in ENA with INCA.
- UVIS performed several slow scans across Titan's visible hemisphere to form spectral images of Titan's upper atmosphere.
- VIMS imaged the surface of Titan at small solar phase angles, and investigated the formation and evolution of clouds on Titan. VIMS also searched for lightning and hot spots and attempts were made for airglow characterization.
Table of Events
22 January
| Time UTC | Time wrt Titan-3 |
Event |
| 10:38 | - 23d 20h | Start of Sequence S08 which contains Titan-3 |
12 February
| Time UTC | Time wrt Titan-3 |
Event |
| 00:07 | - 03d 07h | OTM #13 Prime; Titan-3 minus 3 day targeting manoeuvre |
| 16:37 | - 02d 14h | OTM #13 Backup |
14 February
| Time UTC | Time wrt Titan-3 |
Event |
| 09:07 | - 21h 50m | Start of the TOST Segment |
| 09:37 | - 21h 20m | Turn cameras to Titan |
| 09:37 | - 21h 20m | Deadtime 15 minutes long; used to accommodate changes in flyby time |
| 09:57 | - 21h 00m | Begin long scan across Titan; stratosphere. |
| 18:57 | - 12h 00m | Titan atmospheric observations; monitoring for surface/atmosphere changes |
| 19:57 | - 11h 00m | Titan limb observations; stratosphere |
| 23:57 | - 07h 00m | Titan atmospheric observations; examine wind/cloud motions and capture a low-phase global map |
15 February
| Time UTC | Time wrt Titan-3 |
Event |
| 01:57 | - 05h 00m | Turn to Earth-Line |
| 02:27 | - 04h 30m | Begin Playback of Data, Goldstone 70m |
| 05:27 | - 01h 30m | End Playback of Data |
| 05:27 | - 01h 30m | Turn cameras back to Titan |
| 05:27 | - 01h 30m | High Resolution Imaging |
| 05:58 | - 00h 59m | Transition to Thrusters, duration 21 minutes |
| 06:19 | - 00h 38m | RADAR Altimetry, inbound |
| 06:37 | - 00h 20m | RADAR SAR, Low Resolution Synthetic Aperture RADAR |
| 06:50 | - 00h 07m | RADAR SAR, High Resolution Synthetic Aperture RADAR |
| 06:57 | + 00h 00m | Titan-3 Flyby Closest Approach Time; altitude=1577 km, speed=6.1 kms-1; low phase inbound, 98.4° phase at closest approach, high phase outbound |
| 07:04 | + 00h 07m | RADAR SAR, Low Resolution Synthetic Aperture RADAR |
| 07:17 | + 00h 20m | RADAR Altimetry, outbound |
| 07:29 | + 00h 32m | RADAR Scatterometry, outbound |
| 08:07 | + 01h 10m | Transition to Reaction Wheels, duration 24 minutes |
| 08:30 | + 01h 33m | UVIS Spectral Imaging; several slow scans across Titan's visible hemisphere to form spectral images |
| 11:57 | + 05h 00m | Dark Side Observations of Titan; search for and monitor lightning/aurora |
| 13:27 | + 06h 30m | Titan Photometry; distributions |
| 14:57 | + 08h 00m | Titan limb observations; stratosphere |
| 18:57 | + 12h 00m | Begin long scan across Titan; stratosphere |
| 23:17 | + 16h 20m | Deadtime 15 minutes long; used to accommodate changes in flyby time |
| 23:32 | + 16h 35m | Turn to Earth-Line |
| 23:59 | + 17h 02m | Begin Playback of T3 Data, Goldstone 70m |
16 Feb
| Time UTC | Time wrt Titan-3 |
Event |
| 08:59 | + 01d 02h | End Playback of T3 Data |
Times last updated on 14 February 2005 - Subject to change.
The time is in UT of the event. After this it takes about 1 hour and 8 minutes for the signal to reach Earth.
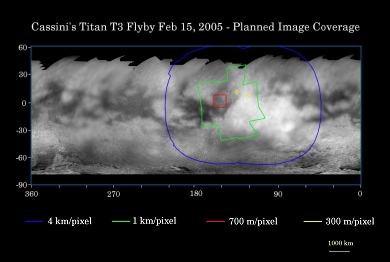
Titan Surface Coverage
This map of the Titan surface illustrates the regions that were imaged by Cassini during the spacecraft's fourth (and third targeted) flyby of the moon.
 |
|
Credit: NASA/JPL/Space Science Institute |
The coloured lines delineate the regions that were imaged at differing resolutions. The lower resolution imaging sequences (outlined in blue) are designed to study the atmosphere, clouds and surface in a variety of spectral filters. Other areas were specifically targeted for creation of mosaics based on moderate resolution images of surface features. Two small areas (outlined in yellow) were seen at high resolution by Cassini's narrow angle camera, and were jointly covered by the visual and mapping spectrometer experiment. These high-resolution targets also overlap areas covered by the Cassini radar altimetry and synthetic aperture radar experiments. The site where the Huygens probe landed in mid-January was imaged at lower resolution during this flyby and is within the terrain in the extreme western part of the coverage area. The low-resolution imaging coverage extends farther east than the previous two close flybys in October and December 2004. Some areas covered at moderate resolution during previous flybys have been targeted again to allow Cassini scientists to look for changes.
The map shows only brightness variations on Titan's surface (the illumination is such that there are no shadows and no shading due to topographic variations). Previous observations indicate that, due to Titan's thick, hazy atmosphere, the sizes of surface features that can be resolved are a few to five times larger than the actual pixel scale labelled on the map.
The map was made from global images taken in June 2004, at image scales of 35 to 88 kilometres per pixel, and south polar coverage from July 2004, at an image scale of 2 kilometres per pixel. The images were obtained using a narrow band filter in the near-infrared centred at 938 nanometres - a wavelength at which light can penetrate Titan's atmosphere. The images have been processed to enhance surface details.
It is currently northern winter on Titan, so the moon's high northern latitudes are not illuminated, resulting in the lack of coverage north of 45 degrees north latitude. Clouds near the south pole have also been removed (south of latitude -75°).
Observation Results
Imaging Science Subsystem (ISS)
|
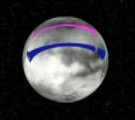
Date: 16 February 2005 Credit: NASA/JPL Image Notes: Animation of Titan as seen by Cassini, with two strips of the RADAR coverage from the October 2004 and February 2005 flybys indicated. |
 |
|
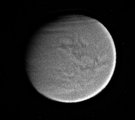
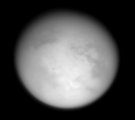
Date: 17 February 2005 Credit:NASA/JPL/Space Science Institute Image Notes: Processed visible light image of Titan, taken by the narrow angle camera with a broad band filter sensitive from ultraviolet to infrared. |
 |
|
Date: 17 February 2005 Credit:NASA/JPL/Space Science Institute Image Notes: Mosaic of 16 images showing Titan in polarised infrared light. Images taken with the narrow angle camera. Scale is 1.3 km per pixel. |
 |
|
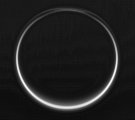
Date: 17 February 2005 Credit:NASA/JPL/Space Science Institute Image Notes: Image of Titan's nightside taken at 460 nm, showing the backlit atmosphere with a detached haze layer encircling the moon. |
 |
|
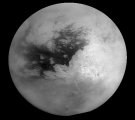
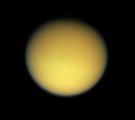
Date: 17 February 2005 Credit:NASA/JPL/Space Science Institute Image Notes: Images obtained with red, green and blue spectral filters were combined to create this natural colour view of Titan. |
 |
|
Date: 17 February 2005 Credit: NASA/JPL/Space Science Institute Image Notes: Looking toward Titan's south pole in in polarised light at 338 nm. Multiple upper stratospheric haze layers are evident in this ultraviolet view. |
 |
|
Date: 15 February 2005 Credit: NASA/JPL Image Notes: Image of Titan in polarised light, taken at 938 nanometres. |
 |
Cassini Radar (RADAR)
|
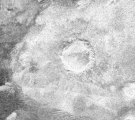
Date: 18 February 2005 Credit: NASA/JPL Image Notes: Radar image showing a crater ~60 km in diameter. Its shape and the surrounding radar bright (hence rough) material suggest an origin by impact. |
 |
|
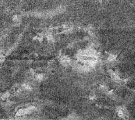
Date: 18 February 2005 Credit: NASA/JPL Image Notes: Complex of bright hills and ridges surrounded by a dark plain. Subtle features could indicate flows of warm ice or mixtures of liquid water and ammonia. |
 |
|
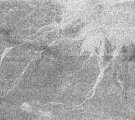
Date: 18 February 2005 Credit: NASA/JPL Image Notes: Area just east of the large impact feature (next image), showing large radar bright channels (up to 200 km long). Possibly rough surfaces of old debris flows. |
 |
|
Date: 16 February 2005 Credit: NASA/JPL Image Notes: A huge annular radio bright feature with an outer diameter of approximately 440 kilometres appears in this radar map. |
 |
|
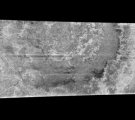
Date: 16 February 2005 Credit: NASA/JPL Image Notes: At several places in this radar mapping strip, dark linear features can be seen running roughly parallel and mostly east-west. |
 |
