Titan Flyby - 25 October 2006
24 October 2006
Only 16 days after Titan-19, Cassini returns to Titan for its twenty-first targeted encounter. The closest approach to Titan occurs on Wednesday, 25 October 2006, at 15:58:07 UT at an altitude of 1030 kilometres above the surface and at a speed of 5.99 kilometres per second. The latitude at closest approach is 7.5° and the encounter occurs on orbit number 31.This encounter is set up with two manoeuvres: an apoapsis manoeuvre on 17 October and an approach manoeuvre on 22 October. This inbound Titan encounter occurs about 2 days before Saturn closest approach.
Science Activities
- Visual and Infrared Mapping Spectrometer (VIMS)
One of the highest resolution VIMS passes in the mission. T20 was highly desired by several teams and after a fierce competition VIMS was chosen. The instrument will hopefully be able to identify geologic features and their correlation with composition (like: what are the dunes made of). Surface shadows at this resolution will be very helpful. The highest resolution will be south and to the west of Elba Facula. In addition, VIMS has a full complement of the normal observations (including global mapping, searching for hot spots, mid latitude cloud evolution). - Imaging Science Subsystem (ISS)
Coverage of Senkyo and Tseghi. - Cassini Radar (RADAR)
Will attempt a high-altitude SAR imaging observation of the Tortola Facula, in addition to inbound radiometry and scatterometry. - Composite Infrared Spectrometer (CIRS)
The highlight of T20 for CIRS is a limb temperature map in the mid-infrared. These are low spectral resolution maps performed quickly to give a snapshot of the vertical meridional temperatures. CIRS aligns its slit at normal to the surface and marches from equator to pole. This is repeated at regular intervals throughout the mission to search for seasonal changes. CIRS is also used for some limb compositional studies despite low spectral resolution. - Dual Technique Magnetometer (MAG)
T20 is suitable to study the wake, tail formation and Saturn facing flank region, where the magnetic field topology may be particularly complex. The very close approach makes this encounter orbit particularly useful for studies of an internal magnetic field. - Magnetospheric and Plasma Science (MAPS)
In general the flybys around T20 are relatively similar. They approach over 35° latitude, ~135° west longitude (moving from north to south) and local time is around 2 am. The full suite of RPWS, CAPS, MIMI, and INMS taking data during this flyby, and the MAPS instruments get to choose the overall pointing of the spacecraft from -52 minutes down to -10 minutes from closest approach.
Table of Events
22 October 2006
| Time UTC | Time wrt Titan-20 |
Activity |
| 09:26:00 | -03d 07h | OTM # Prime; Titan-20 minus 3 day targeting manoeuvre |
| 18:26:00 | -02d 22h | Start of Sequence S25 which contains Titan-20 |
23 October 2006
| Time UTC | Time wrt Titan-20 |
Activity |
| 01:56:00 | -02d 14h | OTM # Backup; X-band to Earth |
| 10:56:00 | -02d 05h | Start of TOST Segment |
24 October 2006
| Time UTC | Time wrt Titan-20 |
Activity |
| 18:26:00 | -21h 32m | Turn cameras to Titan; ISS-NAC to Titan |
| 19:18:07 | -20h 40m | Titan atmospheric observations. Composition; clouds; global mapping; development and evolution of clouds; haze characterization; photometry |
25 October 2006
| Time UTC | Time wrt Titan-20 |
Activity |
| 08:28:07 | -07h 30m | Titan medium resolution surface observations. Identification of geologic features including volcanoes, eolian features, and craters, and their correlation with composition. Search for shadows |
| 10:28:07 | -05h 30m | RADAR inbound radiometry and scatterometry, and possible high altitude SAR. Observe surface properties (roughness and composition). Attempt a high altitude SAR (radio image of Titan's surface) over Tortola Facula |
| 14:44:07 | -01h 14m | Transition to thrusters. Thrusters are needed to compensate for Titan atmosphere torque and target motion compensation |
| 15:06:07 | -00h 52m | Observations of plasma flow. Ideal pointing to capture plasma flow in the field of view of CAPS |
| 15:48:07 | -00h 10m | Highest resolution infrared surface observation (compositional map). Mapping of geology within the context of spectral end members |
| 15:58:07 | +00h 00m | Titan-20 flyby closest approach time. Altitude = 1030 km, speed = 5.99 kms-1, high phase inbound, 25° at closest approach, low phase outbound |
| 16:18:07 | +00h 20m | Transition to reaction wheels, which are used for greater spacecraft stability |
| 16:40:07 | +00h 42m | High resolution infrared surface observation. Identification of geologic features, and their correlation with composition |
| 17:58:07 | +02h 00m | Titan surface observation. Coverage of Senkyo and Tsegihi |
| 20:28:07 | +04h 30m | Titan Atmospheric observation. Mid-infrared limb composition integrations, which have previously yielded information on the vertical profiles of temperature and nitriles |
| 23:28:07 | +07h 30m | Titan surface observation. Search for hot spots and lightning |
| 23:58:07 | +08h 00m | Titan surface observation. Cloud evolution |
26 October 2006
| Time UTC | Time wrt Titan-20 |
Activity |
| 02:37:00 | +10h 39m | Turn to Earth, X-band to Earth |
| 03:07:00 | +11h 09m | Begin playback of T20 data. Madrid 34-meter station |
| 07:56:00 | +15h 58m | Continue playback of T20 data. Goldstone 70-meter station |
27 October 2006
| Time UTC | Time wrt Titan-20 |
Activity |
| 09:20:00 | +01d 17h | Continue playback of T20 data. Goldstone 70-meter station |
28 October 2006
| Time UTC | Time wrt Titan-20 |
Activity |
| 00:10:48 | +02d 08h | Saturn Periapse, R = 4.7 RS, lat = -26°, phase = 16° |
Observation Results
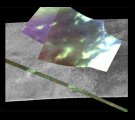
Cassini Instrument: Cassini Radar (RADAR) and Visual and Infrared Mapping Spectrometer (VIMS)
|
Date: 12 December 2006 Credit: NASA/JPL/University of Arizona Image Notes: This composite radar and VIMS view, holds the strongest indication yet of cryovolcanism on Titan: a possible flow of material out from a small crater |
 |
|
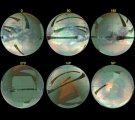
Date: 12 December 2006 Credit: NASA/JPL/University of Arizona Image Notes: Set of composite images constructed from the best Cassini radar data and VIMS data obtained from all Titan flybys up to 25 October 2006 |
 |
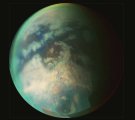
Cassini Instrument: Visual and Infrared Mapping Spectrometer (VIMS)
|
Date: 12 December 2006 Credit: NASA/JPL/University of Arizona Image Notes: Composite of several images taken during the two Titan flybys in October 2006 at the three wavelengths 1.3, 2 and 5 μm |
 |
|
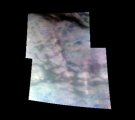
Date: 12 December 2006 Credit: NASA/JPL/University of Arizona Image Notes: High-resolution infrared views of Titan, showing an area riddled by mountain ranges that were probably produced by tectonic forces |
 |
|
Date: 12 December 2006 Credit: NASA/JPL/University of Arizona Image Notes: Composite high-resolution infrared image of a massive mountain range, ~150 km long and 30 km wide, running just south of Titan's equator |
 |
