No. 44 - Preparation for Push-broom Operations
The work of the Mission Control Team has been focused on resuming Science operations and the planning cycle associated to it.
In parallel, part of the Flight Control Team were deployed presenting the SMART-1 mission in several forums around the world. This will be completed with the last presentation of the year planned in Princeton in November.
Spacecraft Status
AOCS
The figure and table below shows the startracker CCD temperatures for the period covered by this report. The temperature for CHU2 CCD has been relatively high during the entire period with an average temperature of 15.87 °C and a maximum temperature of 22.38 °C, but this high temperature was achieved only once. The temperatures for CHU2 have been, most of the times, below 19 °C.
The reason for the CHU2 CCD temperature being this high is that the spacecraft has been pointing with its +X axis to the Sun mostly during this period except for few occasions when the spacecraft was pointing with the +X to Earth for high rate communications using the MGA. It is known that pointing the +X axis to the Sun exposes the CHU2 inner baffle slightly which is enough to get the CHU2 CCD temperature close to or above the operational limit.
Temperatures for CHU1 have been low for most of the reporting period with temperatures below 10 °C except for few occasions that correspond to MGA pointing to Earth where the peak temperatures reached 19.66 °C.
The temperatures for both CHUs decreased after 10 October due to the change of the high thermal mode to low thermal mode. The peak temperatures for CHU1 and CHU2 decreased by approximately 6 °C. After this change the temperatures of the S/C units decreased in general, so the heat flux to the CCD of the CHUs was also reduced.
|
ST CCD Temperatures (A201T= CCD1; A202T=CCD2) |
The following table lists the temperature statistics for this period.
| Camera Head Unit |
Min. T (°C) |
Max. T (°C) |
Average (°C) |
| CHU1 |
-6.9 |
+19.66 |
+5.37 |
| CHU2 |
+1.6 |
+22.38 |
+15.87 |
Electric Propulsion, Power and Thermal
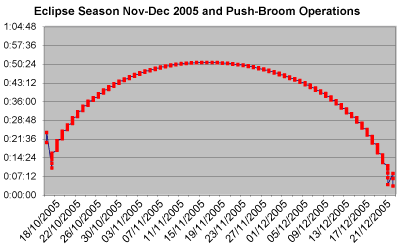
The Power Subsystem has working very well during the reporting period. The diagram below shows the umbra duration during the eclipse season starting on 18 October.
 |
A preliminary analysis of the performance of the batteries was performed and for the moment, no degradation was found. The variables as spacecraft thermal mode, spacecraft attitude and consumption are not identical to the previous eclipses, so the comparison is not so straight forward but as a first check, the time to end of charge looks nominal. Further analysis will be performed as the eclipse season evolves.
Orbital Information
|
SMART-1 OD370 Close to Apolune 1351 Elements WRT Moon and its equator of date | |
| Pericentre Distance (km) | 2267.532760 |
| Apocentre Distance (km) | 4566.135771 |
| Semi Major Axis (km) | 3416.834266 |
| Eccentricity | 0.336364 |
| Inclination (°) | 90.285288 |
| Ascending Node (°) | 237.863463 |
| Argument of Pericentre (°) | 286.635134 |
| True Anomaly (°) | 180.000001 |
| Osculating Orbital Period (h) | 4.978415 |
The changes since apolune 1216 are as follows:
- semi-major axis +0.0 km
- perilune height +77.8 km
- apolune height -78.0 km
- orbital period -0.0 min
