Preliminary science results from Rosetta's third Earth swingby
Below are some of the early results from these activities. Detailed analysis of the data gathered during the Earth swingby is on-going.
VIRTIS
Visible and InfraRed Thermal Imaging Spectrometer
 |
|
Click image for more details |
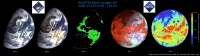
This sequence of five images shows the capability of VIRTIS to isolate desired features of the observed object using the spectral data. The first two images of the sequence are colour composites made by choosing two different sets of three spectral bands in the visual waveband range. The middle image is a false-colour image that shows the distribution of chlorophyll. The fourth image is a composite made using three spectral bands in the infrared. The final image shows the Earth as seen in a single narrow infrared band at 5.0 µm.
Credit: INAF-IFSI/INAF-IASF/ASI
SREM
Standard Radiation Environment Monitor
 |
|
Click image for more details |
These plots show the measurements of the electron and proton count rates, the Earth's magnetic field strength and the derived electron fluxes in different energy ranges.
Credit: ESA/Paul Buehler/PSI
RPC
Rosetta Plasma Consortium
 |
|
Click image for more details |
Starting at 20:00 UTC on 9 November 2009, the RPC monitored the Earth's plasma environment and performed magnetospheric studies for a period of one week around closest approach. During this period, on 10 November 2009, the RPC's Langmuir Probe (LAP) picked up clear signals from Rosetta's thrusters being fired.
Credit: ESA/RPC-LAP/IRF Uppsala
