No. 41 - In-flight Commissioning of the Near Sun Hibernation Mode
NSHM commissioning started on 25 April and ended on 12 May, with a transition back into the normal GSEP attitude control mode (with new pointing guidance). During the whole commissioning period daily monitoring (except for the weekends) of the spacecraft status and performance was carried out via New Norcia. A first analysis of the commissioning results indicates that the spacecraft performed as expected both from an AOCS (Attitude and Orbit Control System) and system level point of view.
No payload operations were carried out, with the exception of SREM, which is active continuously for radiation monitoring.
A total of 16 New Norcia passes, each with a duration of about 7 hours commanding, were taken over the three weeks of the reporting period. Pass duration had to be reduced slightly (of the order of one hour per day) due to a limitation in the azimuth range of the antenna, which only affects the Rosetta mission when the spacecraft declination is close to the one of the ground station latitude. This azimuth limitation is a seasonal effect and will stop affecting Rosetta as from 25 May.
|
NNO Pass |
Date |
DOY |
Main Activity |
|
420 |
24.04.05 |
114 |
Monitor pass – verify NSHM preconditions |
|
421 |
25.04.05 |
115 |
Enter NSHM |
|
422 |
26.04.05 |
116 |
Widen NSHM control deadband |
|
423 |
27.04.05 |
117 |
Monitoring pass – NSHM wide deadband |
|
424 |
28.04.05 |
118 |
Monitoring pass – NSHM wide deadband |
|
425 |
29.04.05 |
119 |
Monitoring pass – NSHM wide deadband |
|
428 |
02.05.05 |
122 |
Monitoring pass – NSHM wide deadband |
|
429 |
03.05.05 |
123 |
Reduce deadband and repoint Solar Array |
|
430 |
04.05.05 |
124 |
HGA repositioning test |
|
431 |
05.05.05 |
125 |
Monitoring pass – NSHM narrow deadband |
|
432 |
06.05.05 |
126 |
Widen NSHM control deadband |
|
435 |
09.05.05 |
129 |
Monitoring pass – NSHM wide deadband |
|
436 |
10.05.05 |
130 |
Monitoring pass – NSHM wide deadband |
|
437 |
11.05.05 |
131 |
Monitoring pass – NSHM wide deadband |
|
438 |
12.05.05 |
132 |
Exit NSHM |
|
439 |
13.05.05 |
133 |
Monitor pass – verify TTC reconfiguration |
At the end of the last New Norcia pass in the reporting period (DOY 133) Rosetta was at 25.6 million km from the Earth. The one-way signal travel time was 1 minute and 25.3 seconds.
Science Results First Earth Swing-by
On 4 and 5 March 2005 the VIRTIS instrument performed observations of the Earth and of the Moon during the first Earth Swing-by.
Operations were divided in three sets of observations:
- Moon observation before closest approach with the Earth
- Moon observation after closest approach during the S/C Autonomous navigation mode (Asteroid fly-by Mode)
- Earth observation
The used set of instrument parameters and the observing conditions are summarized in the table below.
| Observation Code | VIRTIS#02 | VIRTIS#05 | VIRTIS#06 |
| Date and time (UT) | 4 Mar 19:30 | 5 Mar 08:00 | 5 Mar 12:30 |
| Target | Moon | Moon | Earth |
| Distance (km) | 400 000 | 210 000 | 250 000 |
| Phase Angle (°) | 111.3 | 127.9 | 91.1 |
| Visible surface (%) | 32 | 19 | 49 |
| Ground resolution (km) | 100 | 52.5 | 62.5 |
| Integration Times (s) | |||
| Channel M-VIS Channel M-IR Channel H |
1, 20, 30 0.5, 2.0, 3.0, 3.5 5, 10 |
1, 15 1.5, 2.0, 3.0 5, 10 |
1 0.5, 1 5, 10 |
| Spectral | |||
| Number of Pixels Sampling M-IR (nm) Sampling M-VIS (nm) |
432 9.4 1.9 |
432 9.4 1.9 |
432, 144 9.4, 28.2 1.9, 5.7 |
| Spatial (only for M) | |||
| FOV along slit (mrad) FOV along Scan (mrad) IFOV (mrad) |
64 15 0.25 |
64 15 0.25 |
64 64 0.25 |
Moon observations (4 March 2005)
The Moon was observed on 4 March at about 19:30 UT from a distance of 400 000 km and with a phase angle of 111.3 degrees, thus only about 32% of the lunar surface was visible.
The lunar disc subtends an angular size of about 8.75 mrad, as seen from VIRTIS, equivalent to about 35 pixels. VIRTIS-H has been used as well for collecting several spectra of the non-illuminated area of the Earth. Four different integration times were used for the infrared (IR) (3.5, 3.0, 2.0, 0.5 s) and three integration times for the Visual (Vis) (1, 20 and 30 s).
The Moon was imaged in the High spatial / High spectral resolution mode, thus achieving a 100 km spatial resolution on the ground and a spectral resolution of 2 nm and 9 nm in the Vis and IR ranges respectively.
|
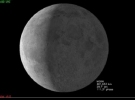
Description: Simulated view of the Moon for the VIRTIS observations on 4 March 2005. |
 |
|
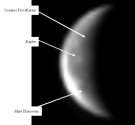
Wavelength: Infrared Description: VIRTIS image of the Moon. It is possible to discern several features: Oceanus Procellarum, the Kepler crater and Mare Humorum. |
 |
|
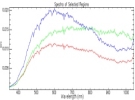
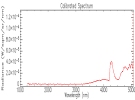
Wavelength: Infrared Description: Plot of three spectra taken at three different locations on the Moon: Kepler crater (blue), Mare Humorum (green) and Oceanus Procellarum (red). |
 |
|
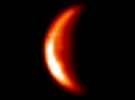
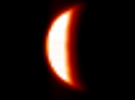
Wavelength: Infrared Description: Monochromatic image of the Moon at a wavelength of 1300 nm. The Sun illumination is from the left. |
 |
|
Wavelength: Infrared Description: Monochromatic image of the Moon at a wavelength of 5000 nm. The Sun illumination is from the left. |
 |
|
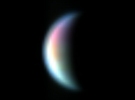
Wavelength: Infrared Description: False-colour image of the Moon, generated by combining the images taken at three different wavelengths: 2225 nm, 3000 nm and 3650 nm. |
 |
Earth observations (5 March 2005)
The Earth images were acquired after the point of closest approach when the Earth was at a distance of 250 000 km. Therefore the pixel size was of the order of 62 km. The integration time was changed in order to verify the VIRTIS performances under different conditions, enabling also the checking of the Instrument transfer function. Earth images were acquired both in the visible and in the infrared, with a mode at high spatial and spectral resolution.
| Description: VIRTIS-M typical data cube. The Earth image has been obtained in 432 bands in the visible (between 0.25 and 1 micrometers) and 432 bands in the infrared (between 1.0 and 5 micrometers). | 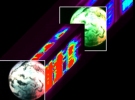 |
|
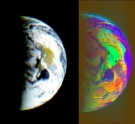
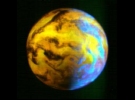
Wavelength: Optical Description: An RGB composite image of the Earth at visible wavelengths. |
 |
|
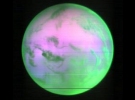
Wavelength: Infrared Description: RGB composite image of three channels. The channels for the plot were selected in order to show the continuum both in the NIR and in the IR. |
 |
|
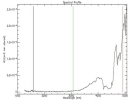
Wavelength: Infrared Description: Spectrum of the Earth. Indicated in this plot are also the three different wavelengths that were used to create the above RGB composite. |
 |
|
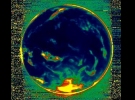
Wavelength: Infrared Description: Distribution of CO2 bands in the Earth's atmosphere. This image is a RGB composite obtained by selecting the 4.2 micrometers band for the green and the two relative continua for blue and red, as shown in the first of the four spectra below. |
 |
|
Wavelength: Infrared Description: Same image as above, but stretched with a Gaussian filter. Two regions characterized by a strong CO2 emission band are identified (yellow), respectively corresponding to Antarctica and to the antipodes of the sub solar point, where the Earth temperature is very low. |
 |
|
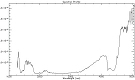
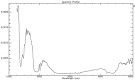
Wavelength: Infrared Description: Typical spectrum of CO2 enhanced region (yellow areas in above RGB image). |
 |
|
Wavelength: Infrared Description: Spectrum of regions near the terminator |
 |
|
Wavelength: Infrared Description: Spectrum of illuminated regions. The spectrum is dominated by CO2 and the water band. |
 |
|
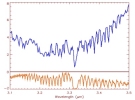
Wavelength: Infrared Description: During the Earth-Moon fly-by VIRTIS-H also observed the Earth. This is an example of a typical VIRTIS-H spectrum. |
 |
